

July 15, 2020
Categories:
Economy is Slowing Down as Coronavirus Cases Climb
After the dismal months of April and May, the economy seemed to be making a recovery in June. However, as Florida quickly became the new epicenter of the coronavirus pandemic, other states have been moving to shut down sectors of their economies that they had reopened to quickly. While the data for this week is still stronger than the any of the numbers we saw in April and May, it is the weakest we have seen since the start of June. Is it just one slow week that will get corrected next week, or is it a sign that we are heading back into a recession?
Purchase Orders
Credit approval requests were way down this week as were total dollars being requested. Both figures came in at 60% of what is considered normal. Since the start of June, the lowest percentage we had seen in number of requests was 73% of normal, while for total dollars it was 78% of normal. While the number of requests being at 60% is still higher than anything we saw from the final week of March through the end of May, we did see total dollars exceed 60% of normal twice during that time period.
Purchases
Meanwhile, purchases were at 66% of what is considered normal. Also, the lowest number we’ve seen since the beginning of June. Yet this percentage was only exceeded twice between the last week of March and the end of May. While these numbers do tend to fluctuate greatly from week to week, the previous week was one of the strongest for purchase orders since the pandemic began.
Payables
If there is a silver lining this week, it would come from payables. After 5 straight weeks of growth in total outstanding dollars, total number of outstanding receivables, and total number of accounts with an outstanding balance, we saw a decline in all three of these categories last week. This week we at least saw increases in 2 of these 3 categories, total outstanding dollars and total number of outstanding receivables, with both growing by 1.6%. Total number of accounts with outstanding balances only declined by half of one percent. However, it did this as some of our oldest receivables finally got paid off.
We did see a slight uptick in current receivable, where the number of current receivables grew by 1.5% and total dollars grew by .9%. As far as what percent of total current receivables account for, the numbers pretty much remained steady from last week declining by only fractions of a percent. Current receivables still make up approximately 70% of all receivables and 81% of total dollars. Both of these percentages would be at the high end of what is considered normal.
For the second straight week we are seeing a large increase in 1-30 days late bucket. This week the number of receivables in this bucket jumped by 6.5% after a 25% increase last week. Meanwhile, total dollars in this bucket jumped by 22% after last weeks’ 60% increase. The growth in this bucket can probably mainly be attributed to growth in small business spending, as small businesses tend to pay a little bit slower than national chains. At this point receivables in the 1-30 days late bucket account for 24% of all receivables and 14% of total dollars, only slightly different from last week and still at the low end of what would be considered normal.
Once again, very little changed in the 31-60 days late bucket although both number of invoices and dollars decreased slightly. These are invoices that would have been created between mid-April and mid-May when lockdowns were in full swing. While Georgia did start their reopening on May 9th, and many other states followed them in the coming week, our data has indicated that reopening did very little to boost the economy of these states. This bucket still holds much less than half of what it normally would, which seems to indicate that if companies were unable to pay for merchandise during the lockdown, that they simply weren’t purchasing any new merchandise.
Now the very positive news comes from the extremely past due invoices. Last week we saw the number of invoices in the 61-90 days late bucket get cut in half, while total dollars declined by 40%. This week we saw the number of invoices in this bucket decline by 15% while total dollars declined by an amazing 76%. Total invoices in this bucket now account for 1.3% of all invoices and .3% of all dollars still outstanding, both of which would be considered normal. Considering that about half of these invoices would have been created before stay-at-home orders were put in place, and many of the other ones may have been for purchase orders placed prior to stay-at-home orders, this is extremely positive news.
We also saw the first significant drop in invoices that are more than 91 days past due, and this isn’t the first significant drop since the pandemic, but the first since significant drop we have seen in all of 2020. All of these invoice were not only created prior to the pandemic, but they were all already past due at the time that the first stay-at-home orders went into effect. While we only received payments on a few of these invoices, the ones that got paid were very large ones. The total number of invoices in this bucket declined by 13% this week, while total dollars declined by 22%. This is an incredibly encouraging sign that businesses that were struggling prior to the pandemic are now starting to get caught up once again.
While there is no industry that hasn’t been impacted by the COVID-19 pandemic, the industries that were hurting the most were hospitality and apparel. Of the invoices that got paid off this week that were more than 60 days beyond terms, most seemed to becoming from the hospitality industry, with the vast majority being restaurants, although also a few payments from hotels. Unfortunately, it looks like the apparel industry has been unable to recover, having already lost out on the entire spring season, and now half way through the summer with very slow sales. If schools are unable to reopen in the fall, it can have a devastating impact on the apparel industry.
Payable Trends
New this week, we have created two charts showing payable trends, modeled in the same way that infection charts look with 7-day rolling averages to make it easier to understand. This is very helpful given that we do not receive payments on weekends. We decided to analyze our payment data in two different ways. First, is simply by looking at all of our data, while the second only looks at companies who paid 15 days or more beyond terms. The reason for this is simple, during the pandemic, the vast majority of invoices were going to major retailers who were deemed essential businesses and typically pay their bills on time. As a result, looking at their data doesn’t really reflect the true impact that COVID-19 has had on payables. By only looking at payments that came in 15 days or more beyond terms, we are getting a more precise analysis of small businesses and the businesses that were most impacted by the lockdowns. It is important to keep in mind that we are looking strictly at the average days beyond terms for payments that we did receive, and not at how many payments we actually received. There is no doubt that we received much fewer payments while businesses were closed, so the payments that we did receive at that time would have a much greater impact on the average days beyond terms than at times when we are receiving a normal amount of payments.
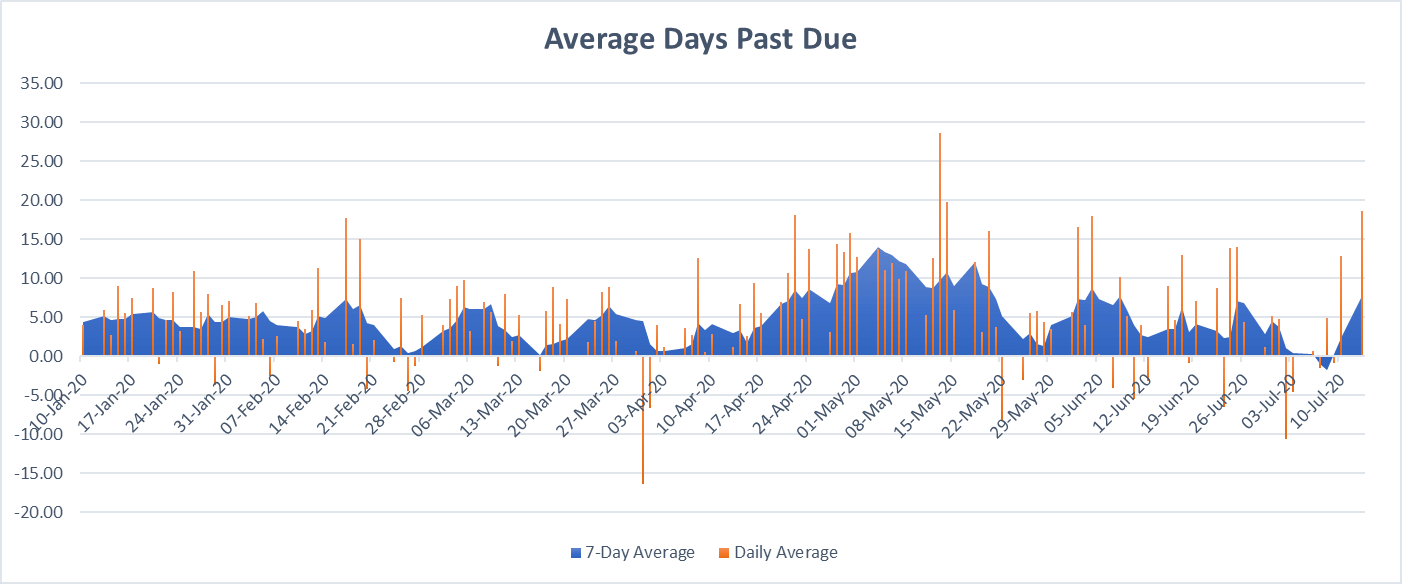
As we can see from the above chart which takes all payments into consideration, it was from mid-April to the end of May that we saw the payments slow down the most, with the 7-day average peaking on May 4th at 14 days beyond terms. On average, bills got paid 4.9 days beyond terms during 2020.
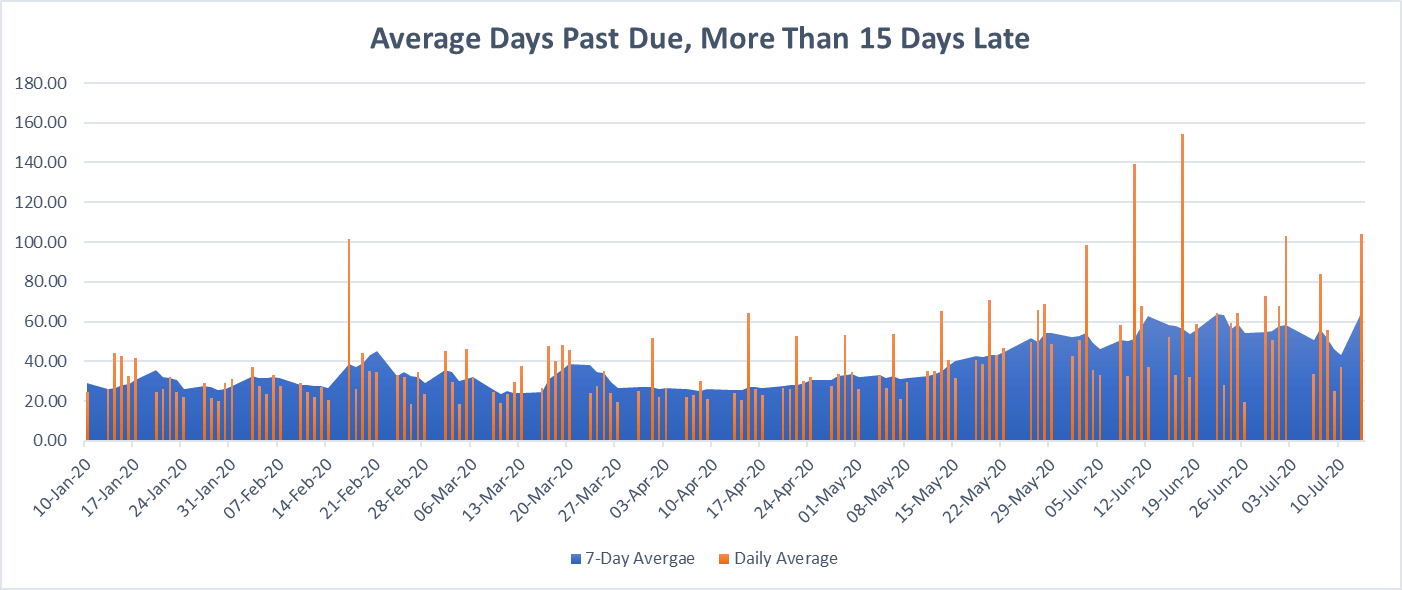
However, above we are looking only at late payments, which are payments that came in 15 days or more beyond terms, we see a very different story. In this situation we see number remaining fairly level until mid-May, at which point they start to grow. Looking at 7-day averages, we actually see several peaks in this graph. The first occurred on June 12th at 63 days beyond terms, the second occurred on June 22nd at 64 days beyond terms, and then just two days ago on July 13th, at 65 days beyond terms. On average, payments that came in late in 2020, were paid 35 days beyond terms.
Obviously getting paid on one very delinquent invoice can greatly skew these numbers, as does a smaller sample size to pull from. Even though the highest numbers for late payments occurred just two days ago, at this point in time we are also receiving fewer past due payments. A perfect example of this is on June 10th when the average payment came in 5.5 days early, but the average past due payment came in 139 days late. What we can infer from these two charts is that most businesses that fell behind were able to catch up between mid-April and the end of May. At this point in time, most companies are paying bills on time, although the ones that are past due are paying bills that are extremely past due and may even pre-date the pandemic.
State-by-State
Again, very little has changed in terms of how local economies are doing on a state-by-state basis. We will continue to compare states that issued stay-at-home orders prior to March 28th to those that did so afterwards, those that started reopening prior to May 9th, the those that did so afterwards, and states that were surging as of June 23rd, to those that were remaining stable or declining. We will also look at the economies of Arizona, Florida, Louisiana, South Carolina, and Texas, five of the states that are experiencing some of the largest outbreaks at this time.
In states that implements stay-at-home orders prior to March 28th, between March 28th and May 9th, businesses in these states operated at 74% of normal levels. Since May 9th they have been operating at 96% of normal levels, same as last week. Meanwhile, businesses in states that didn’t implement orders until after March 28th, only operated at 22% of normal levels prior to May 9th, and 68% of normal levels after May 9th, which is up 1% over last week.
In states that started the reopening process prior to May 9th, businesses in these states were operating at only 25% of normal levels prior to May 9th. They are now operating at 53% of normal levels since May 9th, a 3% increase over last week. However, businesses in states that waited until after May 9th to start their reopening process were operating at 61% of normal levels before May 9th, and have been operating at 99% since May 9th, a 1% decrease since last week.
In states that were surging as of June 23rd, businesses had been operating at 49% of normal levels prior to May 9th, and since have been operating at 65% of normal levels, a 1% increase over last week. In states that had COVID-19 under control as of June 23rd, businesses were only operating at 44% of normal levels prior to May 9th, since that time they have been operating at 113% of normal levels, same as last week. It is important to note that many of the states that had stable or declining infection rates as of June 23rd, now have rising infection rates.
In Arizona, Florida, Louisiana, South Carolina, and Texas, businesses were operating at a dismal 18% of normal levels prior to May 9th, and since have recovered to 54% of normal levels. That is a 6% increase over last week’s data, but it will be interesting to see if they can maintain that pace as the infection rate in these states is rivaling the infection rate in New York at the start of the outbreak, and Florida just recently set the record for the largest number of infections in a single day for any state.
It is still very clear that a state’s ability to contain an outbreak is directly related to how strong its local economy is. It is also clear that by correcting missteps in containing the virus can also help to correct the economy, as can be seen in our comparison of states that were surging as of June 23rd to those that weren’t. Despite this week’s slight downturn, it does appear that businesses have found their new normal. However, this week we have seen several large school districts, including Los Angeles, announce that they will not be returning to in-person learning next month. Will the economy be able to keep up this pace if parents are unable to return to work, or is the downturn from this week a sign of what is going to happen a month from now if millions of children are unable to return to school.