
America Posts
Follow American business and economic news right here on DSA Factor's Factoring 101 Blog.
Jump to a Post
- America
- Financing
- Fintech
- Insurance

December 15, 2020
Categories:
It was over a year ago that the coronavirus was first detected, and while the disease didn’t bring drastic change to America until March, that first wave is now long behind us and things have only gotten worse since the summer months. But beyond the disease which has infected millions and taken many lives, the pandemic has also been devastating to our economy. While the most visible effect of the pandemic has been bankruptcies and empty store fronts, the economic effects of the pandemic actually go much deeper than that. Prior to the bankruptcies and store closures we saw a tightening of credit insurance policies combined with an unwillingness for the industry to take on new clients. The pandemic has also led to the disappearance of supply chain financing, which had grown tremendously over the past decade, while at the same time payment terms got extended. In other words, while consumers may only see the disappearance of their favorite stores and restaurants, behind the scenes the vendors who provide stores with their merchandise have not only seen reduced business, but a lack of financing available to them.
Credit Insurance No Longer Available
Credit Insurance has long been a tool available to wholesalers. Typically, in a business-to-business transaction, the company purchasing a product will request payment terms, meaning they won’t pay for the merchandise they receive until 30 days or more after receiving it. Of course, whenever you allow someone to pay for an item after it has been received there is risk involved. For some financially strong customers that risk may be minimal, but for others that may be struggling that risk may be significant. If a company were to file for bankruptcy within those payment terms, not only would they not have to pay you, but they will probably be allowed to keep the merchandise. Should they pay you but then file for bankruptcy within 90 days, you may be required by the bankruptcy court to return those funds. This is why many wholesalers obtain credit insurance, to protect themselves in the event that one of their customers files for bankruptcy.
Credit insurance has been around for a long time, and really hasn’t changed much over the years. Credit insurance remained available and reliable throughout the recession in 2008 and even during the current “retail apocalypse” that has followed. However, due to the rapidly changing business environment that resulted from the COVID pandemic, credit insurance had to make some major changes for the first time in recent history. Near the end of March it began with the slashing of credit limits and a refusal to take on any new clients. The credit insurance companies started lowering credit limits across the board, not only on struggling businesses, if not flat out denying coverage on accounts that they had previously covered. At the same time, they also stopped taking on new clients, even abruptly ceasing communications with potential new clients that they had been working on building policies for.
It is doubtful that credit insurance companies would have lost much money had they continued business as usual. Any outstanding receivables at the time of the initial lockdowns would still need to be covered as the insurance companies can’t backdate changes in credit limits, and oftentimes even give clients a grace period before a credit limit or coverage change goes into effect. Furthermore, businesses stopped placing orders after the initial shutdown, so there really wasn’t any need to lower credit limits. As a result, credit insurance companies didn’t really protect themselves from the bankruptcies since new orders weren’t being placed and they still had to provide coverage on orders that shipped in March or earlier, assuming they were offering coverage on these companies in the first place. The end result of their policy changes was that they turned away new business, and possibly alienated existing customers.
While credit insurance is not something that is visible to consumers, it no doubt effects consumers. If wholesalers are unable to insure an account, it makes them much less likely to be willing to sell to them. This means that the retailers have difficulty stocking merchandise on their shelves and consumers have even less of a reason to shop at their stores. All of this, combined with other difficulties caused by the pandemic, makes it that much harder for a retailer to survive, and ultimately leads them down the path of bankruptcy. However, it isn’t just retailers who got hurt by the lack of credit insurance, wholesalers may have had to walk away from some of their largest customers, putting both their short-term and long-term survival in jeopardy as well.
It is important to understand however that credit insurance companies do not have direct access to a company’s payment trends or even order history when making credit decisions. Credit insurance companies rely on credit reporting in order to get their data. The credit agencies they collect their data from receive reports from actual debtors typically on a monthly basis. Therefore, not only do credit insurance companies not have real-time data to rely on, the data they receive is not their own, and in general only places outstanding receivables into 30-day aging buckets. As a result, a receivable paid one day beyond terms would appear the same as a receivable paid 30 days beyond terms, while a receivable paid 31 days beyond terms will look much worse than a receivable paid 30 days beyond terms. The only time they receive actual real-time data is when a client of theirs has to report a receivable that has become past due by a certain number of days, and later when they ultimately file a claim on a receivable that remains unpaid. The data credit insurance companies would have had access to at the start of April would have looked perfectly normal since businesses would have been closed for at most one week at that time, it wouldn’t be until new data became available at the start of May that they would have noticed a slowdown. Any claims that they would have received at the end of March or beginning of April would have been on invoices that dated back to November 2019 or earlier. So, the decisions made by credit insurance companies in late March and early April were not dictated by data, but simply by fear of the unknown.
Supply Chain Financing’s Disappearance
If tightening credit insurance policies weren’t bad enough for wholesalers, the disappearance of supply chain financing has devasted many smaller wholesalers. Larger retailers always request credit terms from their customers, typically net 30 day terms, meaning that they have 30 days to pay for their merchandise. Over the past decade, it has become increasingly popular for larger retailers to agree to pay an invoice early, oftentimes after only a week or two, in exchange for a discount. Wholesalers may be willing to give these companies a discount, somewhere around 2%, for an early payment in order to improve their cash flow, creating a win-win situation for both the wholesaler and the retailer. However, this offer of early payment is not a requirement and is solely up to the retailer as to whether or not they wish to offer it.
Supply chain financing, and Fintech in general, emerged as a result of the 2008 recession. Venture capitalists saw that financing wasn’t readily accessible to small businesses and decided to use technology to make financing safe and easy. In the years that followed 2008, our economy improved greatly and large businesses were thriving. As a result, the industry grew at a time when our economy was growing, and had never experienced an economic downturn.
Of course, prior to 2020, retailers that offered early payments would have had very little reason to stop offering it, so offers of early payment were consistently available. 2020 of course changed all that when many of these retailers were forced to suddenly and unexpectedly close their stores, as well as the corporate offices where these payments come form, for an unknown period of time. As a result, most retailers stopped offering early payments at the outset of the pandemic, putting their vendors in a difficult situation where they didn’t have access to the funds that they relied on to keep their business running. To make matters worse, with corporate offices closed and without any revenues coming in from their stores, many of the retailers simply stopped making payments, even when the invoices became due. This all happened at a time when wholesalers saw new orders completely dry up and existing orders being canceled.
To make matters worse, many wholesalers who relied on supply chain financing, never bothered to consider getting credit insurance. They didn’t see the need for credit insurance since they were getting paid early. However, just like health insurance, you still need it even if you are young and healthy because you never know what the future may have in store for you. Companies who relied on supply chain financing and didn’t bother to insure their receivables, were suddenly exposed to the fact that these companies that owe them money have now closed all their stores and that bankruptcy was a very serious possibility.
While supply chain financing was still available as a tool available to retailers, retailers no longer wished to use it. Even now, nine months after the first wave of COVID-19 swept across the nation, most major retailers have started placing orders again, but still are not offering supply chain financing to their vendors. To make matters worse, many of them have also increased their payment terms from net 30 days to net 60 days or even net 90 days, forcing their vendors to wait even longer to get paid. Prior to the pandemic, extending payment terms was sign of financial distress and imminent bankruptcy, although this year we believe that it is simply a response to the unknown as stores may have to close again should things become worse. It is possible that supply chain financing may one day be offered again by retailers, but at this point, it is very clear that it is not a reliable way for wholesalers to finance their business. Another recession, or even worse, another pandemic, could easily result in the disappearance of supply chain financing again.
An Alternative to Supply Chain Finance and Credit Insurance
The disappearance of supply chain finance as an affordable way to finance a small business has led to a huge increase in demand for accounts receivable factoring. Factoring is a lot like supply chain finance, except instead of being initiated by the retailer, it is initiated by the wholesaler. It also does not require the approval of the retailer; it is solely at the discretion of the wholesaler as to whether they wished to work with a factoring company. Therefore, wholesalers don’t need to worry as much about when the next disaster will hit, the financing that their business needs is completely within their control.
Factoring also provides access to funds 7-10 days faster than supply chain finance. Where retailers typically need to receive merchandise and check it into their system prior to making an offer of early payment to their vendors, factoring companies are willing to fund their clients the same day they ship their merchandise to their customers. That means even better cash flow than you would have received with supply chain financing.
Furthermore, if non-recourse factoring is offered, then the wholesaler also receives credit insurance on their receivables along with the improved cash flow that they receive. However, unlike credit insurance companies, factoring companies have access to real-time data that shows orders placed and payment trends, along with the data that credit insurance companies receive from credit reporting agencies. As a result, factoring companies can oftentimes approve accounts that a credit insurance company may not feel comfortable with.
Accounts receivable factoring is also available on any and all accounts that a wholesaler may sell to. Where supply chain finance is typically only available from major retailers, and credit insurance comes with minimums and deductibles that pretty much rule out smaller receivables from being insured, factoring companies are willing to work with customers of all sizes. A wholesaler who does half their business with major retailers, and the other half with small mom-and-pop shops, would have access to immediate funding and credit insurance on their entire portfolio if they choose to work with a factoring company, whereas before only half their portfolio would have had financing and insurance available.
The cost of accounts receivable factoring is very comparable to the cost of supply chain financing, and in all likelihood is much less than the cost of supply chain finance and credit insurance combined. Like supply chain financing, factoring fees are based on a percent of an invoices value, however that rate is fixed so you know exactly what to expect every time you factor an invoice and can easily build it into your pricing. With supply chain financing the percentage can change based upon the retailers needs at the time they offering early payment. If a retailer begins to struggle, or if they simply need access to working capital to fund an expansion, they can ask for larger discounts in exchange for early payment.
Credit insurance on the other hand works like any other insurance product, you pay an annual premium based on how much volume you expect to do at the beginning of the year. Larger volumes get you better rates, but you don’t get reimbursed if your sales don’t reach your expectations. Likewise, if your sales exceed your expectations you may find yourself having to purchase additional coverage at a higher rate than had you purchased more coverage in the first place. Even when there isn’t a pandemic, guessing the correct amount of coverage to get can be tricky, while the pandemic pretty much guaranteed that any companies with credit insurance way overpaid for coverage. Since factoring is based on a fixed percent of an invoices value, you only pay for what you insure, nothing more, nothing less. You also don’t need to worry about deductibles or minimums with factoring, if your factoring company approves your customer, then you are fully insured.
Is Factoring Available During a Pandemic or Recession?
Accounts Receivable Factoring is one of the oldest forms of financing and not only has survived many recessions, but has also been available throughout recessions and this current pandemic. Here at DSA Factors we have been providing factoring for over 30 years and have survived several recessions during that time period. There is no question that the COVID pandemic has been the most difficult event that we have had to deal with, but we never stopped providing financing to our clients, not even in April when things were at their worst. However, we aren’t only continuing to fund our clients, we are also accepting new clients and offering them the same great service that we provide to all of our clients. If your business has lost the financing options it had been relying on for the past few years as a result of the pandemic, please give DSA Factors a call today at 773-248-9000. We are ready and willing to provide you with the funds you need to keep your business going!
- America
- Small Business

July 15, 2020
Categories:
Economy is Slowing Down as Coronavirus Cases Climb
After the dismal months of April and May, the economy seemed to be making a recovery in June. However, as Florida quickly became the new epicenter of the coronavirus pandemic, other states have been moving to shut down sectors of their economies that they had reopened to quickly. While the data for this week is still stronger than the any of the numbers we saw in April and May, it is the weakest we have seen since the start of June. Is it just one slow week that will get corrected next week, or is it a sign that we are heading back into a recession?
Purchase Orders
Credit approval requests were way down this week as were total dollars being requested. Both figures came in at 60% of what is considered normal. Since the start of June, the lowest percentage we had seen in number of requests was 73% of normal, while for total dollars it was 78% of normal. While the number of requests being at 60% is still higher than anything we saw from the final week of March through the end of May, we did see total dollars exceed 60% of normal twice during that time period.
Purchases
Meanwhile, purchases were at 66% of what is considered normal. Also, the lowest number we’ve seen since the beginning of June. Yet this percentage was only exceeded twice between the last week of March and the end of May. While these numbers do tend to fluctuate greatly from week to week, the previous week was one of the strongest for purchase orders since the pandemic began.
Payables
If there is a silver lining this week, it would come from payables. After 5 straight weeks of growth in total outstanding dollars, total number of outstanding receivables, and total number of accounts with an outstanding balance, we saw a decline in all three of these categories last week. This week we at least saw increases in 2 of these 3 categories, total outstanding dollars and total number of outstanding receivables, with both growing by 1.6%. Total number of accounts with outstanding balances only declined by half of one percent. However, it did this as some of our oldest receivables finally got paid off.
We did see a slight uptick in current receivable, where the number of current receivables grew by 1.5% and total dollars grew by .9%. As far as what percent of total current receivables account for, the numbers pretty much remained steady from last week declining by only fractions of a percent. Current receivables still make up approximately 70% of all receivables and 81% of total dollars. Both of these percentages would be at the high end of what is considered normal.
For the second straight week we are seeing a large increase in 1-30 days late bucket. This week the number of receivables in this bucket jumped by 6.5% after a 25% increase last week. Meanwhile, total dollars in this bucket jumped by 22% after last weeks’ 60% increase. The growth in this bucket can probably mainly be attributed to growth in small business spending, as small businesses tend to pay a little bit slower than national chains. At this point receivables in the 1-30 days late bucket account for 24% of all receivables and 14% of total dollars, only slightly different from last week and still at the low end of what would be considered normal.
Once again, very little changed in the 31-60 days late bucket although both number of invoices and dollars decreased slightly. These are invoices that would have been created between mid-April and mid-May when lockdowns were in full swing. While Georgia did start their reopening on May 9th, and many other states followed them in the coming week, our data has indicated that reopening did very little to boost the economy of these states. This bucket still holds much less than half of what it normally would, which seems to indicate that if companies were unable to pay for merchandise during the lockdown, that they simply weren’t purchasing any new merchandise.
Now the very positive news comes from the extremely past due invoices. Last week we saw the number of invoices in the 61-90 days late bucket get cut in half, while total dollars declined by 40%. This week we saw the number of invoices in this bucket decline by 15% while total dollars declined by an amazing 76%. Total invoices in this bucket now account for 1.3% of all invoices and .3% of all dollars still outstanding, both of which would be considered normal. Considering that about half of these invoices would have been created before stay-at-home orders were put in place, and many of the other ones may have been for purchase orders placed prior to stay-at-home orders, this is extremely positive news.
We also saw the first significant drop in invoices that are more than 91 days past due, and this isn’t the first significant drop since the pandemic, but the first since significant drop we have seen in all of 2020. All of these invoice were not only created prior to the pandemic, but they were all already past due at the time that the first stay-at-home orders went into effect. While we only received payments on a few of these invoices, the ones that got paid were very large ones. The total number of invoices in this bucket declined by 13% this week, while total dollars declined by 22%. This is an incredibly encouraging sign that businesses that were struggling prior to the pandemic are now starting to get caught up once again.
While there is no industry that hasn’t been impacted by the COVID-19 pandemic, the industries that were hurting the most were hospitality and apparel. Of the invoices that got paid off this week that were more than 60 days beyond terms, most seemed to becoming from the hospitality industry, with the vast majority being restaurants, although also a few payments from hotels. Unfortunately, it looks like the apparel industry has been unable to recover, having already lost out on the entire spring season, and now half way through the summer with very slow sales. If schools are unable to reopen in the fall, it can have a devastating impact on the apparel industry.
Payable Trends
New this week, we have created two charts showing payable trends, modeled in the same way that infection charts look with 7-day rolling averages to make it easier to understand. This is very helpful given that we do not receive payments on weekends. We decided to analyze our payment data in two different ways. First, is simply by looking at all of our data, while the second only looks at companies who paid 15 days or more beyond terms. The reason for this is simple, during the pandemic, the vast majority of invoices were going to major retailers who were deemed essential businesses and typically pay their bills on time. As a result, looking at their data doesn’t really reflect the true impact that COVID-19 has had on payables. By only looking at payments that came in 15 days or more beyond terms, we are getting a more precise analysis of small businesses and the businesses that were most impacted by the lockdowns. It is important to keep in mind that we are looking strictly at the average days beyond terms for payments that we did receive, and not at how many payments we actually received. There is no doubt that we received much fewer payments while businesses were closed, so the payments that we did receive at that time would have a much greater impact on the average days beyond terms than at times when we are receiving a normal amount of payments.
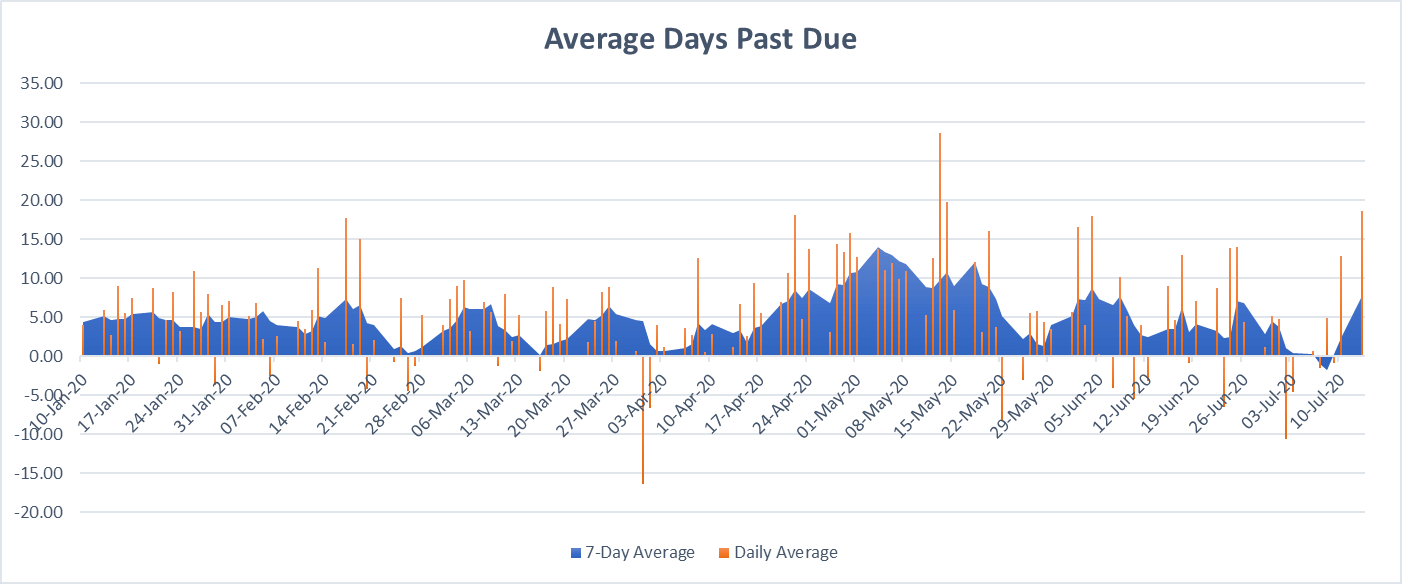
As we can see from the above chart which takes all payments into consideration, it was from mid-April to the end of May that we saw the payments slow down the most, with the 7-day average peaking on May 4th at 14 days beyond terms. On average, bills got paid 4.9 days beyond terms during 2020.
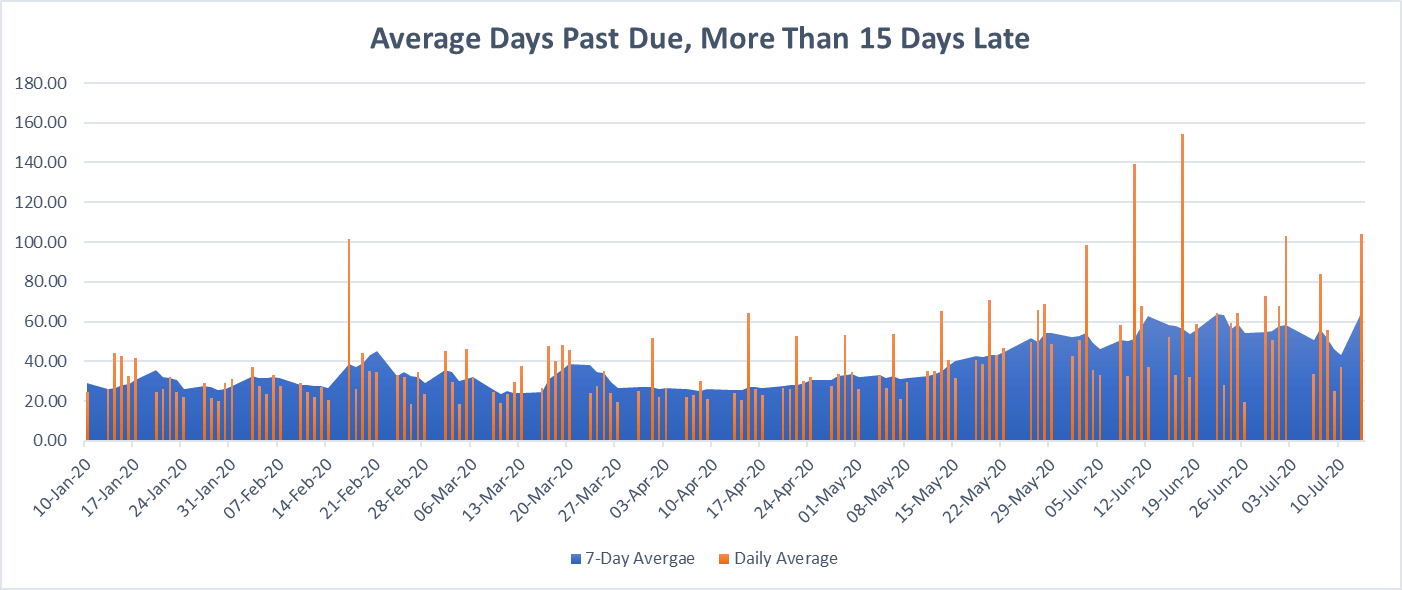
However, above we are looking only at late payments, which are payments that came in 15 days or more beyond terms, we see a very different story. In this situation we see number remaining fairly level until mid-May, at which point they start to grow. Looking at 7-day averages, we actually see several peaks in this graph. The first occurred on June 12th at 63 days beyond terms, the second occurred on June 22nd at 64 days beyond terms, and then just two days ago on July 13th, at 65 days beyond terms. On average, payments that came in late in 2020, were paid 35 days beyond terms.
Obviously getting paid on one very delinquent invoice can greatly skew these numbers, as does a smaller sample size to pull from. Even though the highest numbers for late payments occurred just two days ago, at this point in time we are also receiving fewer past due payments. A perfect example of this is on June 10th when the average payment came in 5.5 days early, but the average past due payment came in 139 days late. What we can infer from these two charts is that most businesses that fell behind were able to catch up between mid-April and the end of May. At this point in time, most companies are paying bills on time, although the ones that are past due are paying bills that are extremely past due and may even pre-date the pandemic.
State-by-State
Again, very little has changed in terms of how local economies are doing on a state-by-state basis. We will continue to compare states that issued stay-at-home orders prior to March 28th to those that did so afterwards, those that started reopening prior to May 9th, the those that did so afterwards, and states that were surging as of June 23rd, to those that were remaining stable or declining. We will also look at the economies of Arizona, Florida, Louisiana, South Carolina, and Texas, five of the states that are experiencing some of the largest outbreaks at this time.
In states that implements stay-at-home orders prior to March 28th, between March 28th and May 9th, businesses in these states operated at 74% of normal levels. Since May 9th they have been operating at 96% of normal levels, same as last week. Meanwhile, businesses in states that didn’t implement orders until after March 28th, only operated at 22% of normal levels prior to May 9th, and 68% of normal levels after May 9th, which is up 1% over last week.
In states that started the reopening process prior to May 9th, businesses in these states were operating at only 25% of normal levels prior to May 9th. They are now operating at 53% of normal levels since May 9th, a 3% increase over last week. However, businesses in states that waited until after May 9th to start their reopening process were operating at 61% of normal levels before May 9th, and have been operating at 99% since May 9th, a 1% decrease since last week.
In states that were surging as of June 23rd, businesses had been operating at 49% of normal levels prior to May 9th, and since have been operating at 65% of normal levels, a 1% increase over last week. In states that had COVID-19 under control as of June 23rd, businesses were only operating at 44% of normal levels prior to May 9th, since that time they have been operating at 113% of normal levels, same as last week. It is important to note that many of the states that had stable or declining infection rates as of June 23rd, now have rising infection rates.
In Arizona, Florida, Louisiana, South Carolina, and Texas, businesses were operating at a dismal 18% of normal levels prior to May 9th, and since have recovered to 54% of normal levels. That is a 6% increase over last week’s data, but it will be interesting to see if they can maintain that pace as the infection rate in these states is rivaling the infection rate in New York at the start of the outbreak, and Florida just recently set the record for the largest number of infections in a single day for any state.
It is still very clear that a state’s ability to contain an outbreak is directly related to how strong its local economy is. It is also clear that by correcting missteps in containing the virus can also help to correct the economy, as can be seen in our comparison of states that were surging as of June 23rd to those that weren’t. Despite this week’s slight downturn, it does appear that businesses have found their new normal. However, this week we have seen several large school districts, including Los Angeles, announce that they will not be returning to in-person learning next month. Will the economy be able to keep up this pace if parents are unable to return to work, or is the downturn from this week a sign of what is going to happen a month from now if millions of children are unable to return to school.
- America
- Small Business
July 8, 2020
Categories:
The Economy is Stabilizing as the Pandemic Intensifies
There are now over three million Americans who have been infected with COVDI-19, yet as the pandemic rages on, the economy seems to have stabilized. Once again very little has changed this past week for the economy according to our data. While the economy has yet to make a full recovery, it does seem that retailers in states that have done a good job controlling the coronavirus may have returned to normal levels of business. However, as infection rates continue to skyrocket across most of the South and West, the retailers in these states are still suffering.
Purchase Orders
Credit approval requests were up again this week with the number of requests at 81% of normal levels, we’ve only seen the number of approvals reach this level once before and that was during the first week of June. Meanwhile, dollars requested reached 93% of normal levels, which isn’t a peak, but still very high.
Purchases
Purchases jumped significantly last week reaching 92% of normal levels, the highest level yet since the pandemic began if we don’t include extremely large orders that have skewed the numbers. This is a very promising number and falls in line with some of the approvals numbers we’ve seen over the last few weeks.
Payables
Payables continue to look good. After 5 straight weeks of continual growth in total outstanding dollars, we experienced a 4.5% decline this week, despite some of our highest purchase levels yet. While this would imply that more invoices got paid off than were purchased, interestingly the total volume of current receivables declined by 6% while the total number of past due receivables increased by 2.5%. This would mean that we must have received a large number of payments prior to the invoices becoming due this week. We are saw a 4% decline in both the number of open receivables and number of accounts with open receivables, marking the first time we’ve seen these numbers decline in quite a few weeks now.
Despite the decline in current receivables, current receivables still make up 70% of all receivables and 82% of total dollars. Both of these numbers would be at the high end of what is considered to be normal. So, it still appears to be the case that companies that are placing orders have the ability to pay for them in a timely fashion. Furthermore, current dollars are still at 92% of where they were on March 1st, our last data point before the pandemic took a major toll on the economy.
Ever since reaching their peak in mid-April, the 1-30 days late bucket had been in decline until last week when the number of invoices grew by 25% and dollars grew by 60%. This week continued that growth in this bucket but at a slower rate. The number of invoices that are 1-30 days beyond terms grew by 10%, while total dollars grew by 12%. Despite two straight weeks of growth, invoices in the 1-30 days late bucket still only account for 23% of all invoices and 12% of all dollars. Both of these percentages would be at the low end of what is considered normal. Again, the growth in this bucket can most likely be attributed to the growth in the current bucket that began in mid-May and continued throughout June. For that reason, it would be safe to assume that we will be seeing continued growth in this bucket throughout July.
The 31-60 days beyond terms bucket remained stable this week, with virtually no change in terms of number of number of invoices or dollars. Al of these invoice would have been created between early April and early May, at the height of the pandemic, so companies placing orders at that time would have been well aware of the difficulties that they would be facing. As a result, this bucket still holds much less than half of what we would consider to be normal, so not seeing any change isn’t really a cause for concern.
The positive news this week occurred with invoices that are severely past due. Invoices in the 61-90 days late bucket were cut in half, and total dollars in this bucket declined by 40%. These invoices now make up 1.5% of all invoices and 1.3% of all dollars, percentages that would both be at the high end of what is considered normal. These invoices would have mostly been created prior to stay-at-home orders being enacted, and all of them would have become due after non-essential businesses would have been forced to shut their doors. To see these numbers as drop significantly as they have is a major sign that businesses have been able to recover.
Unfortunately, we saw virtually no change in invoices that are 91 days or more beyond terms. In fact, we’ve seen virtually no change in this category going all the way back to February 1st. These are all accounts that were already past due (some severely past due) at the time that stay-at-home orders were issued and businesses were forced to close their doors. It is not surprising that businesses that were already struggling prior to the pandemic would continue to struggle at this time.
State-by-State
Nothing much has changed in terms of which states’ economies are doing better. It still appears to be the case that the states that took greater precautions and had greater success in slowing the spread of the coronavirus, also managed to minimize the blow on their local economy. We will continue using the 3 dates that we have been looking at in order to make comparisons. We will be comparing states that issued stay-at-home orders prior to March 28th, to those that issued orders after. We will compare states that started their reopening process prior to May 9th, to those that started later. And we will compare states that were surging as of June 23rd, to those that were remaining stable or improving at that time. Additionally, we will also look at states that have experienced exponential growth in infections over the past few weeks.
For states that implements stay-at-home orders prior to March 28th, between March 28th and May 9th, businesses in these states operated at 74% of normal levels. Since May 9th they have been operating at 96% of normal levels, which is down 2% from last week. Meanwhile, businesses in states that didn’t implement orders until after March 28th, only operated at 22% of normal levels prior to May 9th, and 67% of normal levels after May 9th, which is also down 2% from last week.
For states that started the reopening process prior to May 9th, businesses in these states were operating at only 25% of normal levels prior to May 9th. They are now operating at 50% of normal levels since May 9th, a 1% decrease since last week. However, businesses in states that waited until after May 9th to start their reopening process were operating at 61% of normal levels before May 9th, and have been operating at 100% since May 9th, a 2% decrease since last week.
For states that were surging as of June 23rd, businesses had been operating at 49% of normal levels prior to May 9th, and since have been operating at 64% of normal levels, marking no change since last week. In states that had COVID-19 under control as of June 23rd, businesses were only operating at 44% of normal levels prior to May 9th, since that time they have been operating at 113% of normal levels, a 5% decrease since last week. It is important to note that many of the states that had stable or declining infection rates as of June 23rd, now have rising infection rates.
New this week, we will be looking at one more number, we will look at the states that have experienced exponential growth in infections over the past few weeks. Those states are Arizona, Florida, Louisiana, South Carolina, and Texas. While Louisiana was one of the hardest hit states early on in the pandemic, they seemed to had gotten the virus under control up until about a month ago. The other four states had relatively low case counts early on, but now appear to be having infection rates that rival what New York saw at the start of the pandemic. Businesses in these states, all of which are heavily reliant on tourism, were operating at a dismal 18% of normal levels prior to May 9th, and since then have only been able to recover to 48% of normal levels.
Looking at the US as a whole, the nation’s economy was operating at 47% of normal levels prior to May 9th, and has been operating at 81% of normal levels since then. While we can not say that the economy of the US has recovered, it does at least appear to have stabilized for now. However, given the horrible numbers coming out of Arizona, Florida, Louisiana, South Carolina, and Texas, which typically make up about a quarter of our nation’s economy, it is easy to see how the economy could quickly stumble again if the nation fails to get COVID-19 under control.
- America
- Small Business
July 2, 2020
Categories:
Has the Economy Recovered from COVID-19?
As has been the case for the last few weeks, the data we have from this week appears to be remaining stable. This of course begs the question, has the economy recovered? While certainly plenty of damage has been done to the economy, there is no doubt that the economy has bounced back significantly and may have possibly reached its “new normal”. This week, given that the month of June has come to a close, we will be doing a month by month comparison, comparing 2020 to the years 2017-2019.
Purchase Orders
Credit approval requests were slightly down this week at 73% of normal levels, after reaching 78%, 76%, and 81% over the previous three weeks. Total dollars seemed to have stabilized as well at 78% of normal levels, after hitting 147%, 78%, and 101% during the previous three weeks, with that 147% primarily be driven from a single extremely large purchase order. While these numbers may not be very promising, these percentages are calculated against an annual average and does not take into account monthly fluctuation.
Comparing the approval volume from 2020 to the average volume between 2017 and 2019, we will find that January 2020’s volume was pretty much normal, at 93% of the volume we experienced in the Januarys of the previous 3 years. February 2020 began to show a slowdown as the volume was only at 77% of previous years’ Februarys. While COVID-19 may not have appeared to be a problem in the US back in February, it was already creating supply chain problems for importers from China and elsewhere in Asia, and this could help explain the decline in volume. The pandemic didn’t really impact the US until March, and it was only the final week in March when the first stay-at-home orders were put in place and businesses were forced to close, as a result volume was down to 61% of previous years’ Marchs. April of course was the height of the pandemic and volume in April plummeted to 43% of previous years’ Aprils, and only improved slightly in May to 48%. However, as many stay-at-home orders began to get lifted towards the end of May and most businesses were able to open up in June, June’s volume climbed to 96% of previous years’ Junes. It will be interesting to see if July can stay on pace, but this monthly data is a very strong indication of an improved economy as it averages out all of the weekly fluctuations we have been seeing.
Purchases
If we ignore the one very large purchase we had last week, purchases remained steady this week at 69%. While this may not be as high as they had been at the start of the month, it is still a very significant improvement over earlier in the pandemic when they averaged only 52% during the months of April and May.
We’ve been saying all along how purchases tend to fluctuate wildly from week to week, which of course makes the data a little hard to read. However, if we aggregate the data by month, as opposed to by week, those fluctuations should be flattened out. It is also important to note that the weekly data was being compared to annual average, and it too does not account for normal monthly fluctuations. So starting with January, we found that this year’s purchases were 92% of the average January from 2017 to 2019, which is perfectly in line with what we saw from approvals. Furthermore, supply chain problems in Asia would not have been impacted at this point in time as any ships would have departed prior to the first reported cases of COVID-19 in China. February saw purchases drop to 74% of the previous three years’ Februarys, quite possibly due to supply chain issues that emerged in Asia back in January. Purchases in March dropped further to 67% of the previous three years’ Marchs, as businesses began to shutdown at the end of the month and stay-at-home orders began to get implemented. April of course continued the descent to 44% of previous Aprils’ purchases, as some businesses were still open at the start of the month, and others still accepted orders placed prior to stay-at-home orders. Purchases bottomed out in May at 37% of the average May over the previous three years. However we did see a major rebound in June when purchases climbed to 59% of June’s average over the previous three years. The large discrepancy between purchases and purchase orders is due to the fact that purchase data tends to lag behind purchase order data be several weeks as it takes time to put together the orders, especially the larger orders that make up the bulk of these numbers. June’s purchase order numbers should be a very strong indication that purchases will return to near normal levels in July.
Payables
Payables continue to remain on track and heading in the right direction all across the board. Total outstanding dollars are up 5.5% making this the 5th consecutive week of growth, while the number of accounts with an open balance and the number of open receivables both climbed by 9%. Meanwhile, extremely past due invoices continued to get paid down this week.
While we did see an increase in current receivables, with total number up 1.7% and total dollars up 2.8%, these numbers aren’t growing as quickly as they had over the past few weeks. Still 72% of all receivables and 83% of all dollars are current, which is well above what would be considered normal. Even more amazing is that current dollars are now at 97.5% of where they were at on March 1st.
Meanwhile, the 1-30 day past due bucket made it first very significant increase since mid-April. The number of invoices in this bucket grew by 25%, while total dollars in this bucket grew an amazing 60%. Despite these large increases, there is little cause for alarm as it is probably due to the increase in current receivables that began at the start of June. Furthermore, the number of invoices still only account for 20% and total dollars only account for 10% of all receivables, again, both well below what would be considered normal. When you add up both the numbers and dollars that are either current or in the 1-30 days late bucket, they are within 2-3% of what would be considered normal. This is most likely due to the declining, but still unusually large amount of severely past due invoices, combined with slower purchases over the past two months due to the pandemic.
The 31-60 days beyond terms bucket also continued its sharp decline this week, with total numbers dropping by 25% and dollars dropping 39%. These invoices now only account for 1.8% of all invoices and 0.5% of all dollars. Both of these numbers are less than half of what would be considered normal, which is not surprising given that all these invoice were created in the month of April when businesses would have been well aware of the challenges that they would be facing.
Last week we saw some very worrisome data where invoices that were more than 61 days beyond terms seemed to only age further, with very little getting paid. Luckily this week saw some significant progress, both with invoices that are 61-90 days late and invoices that are over 91 days late. We saw a 12% decrease in the number of invoices and a 8.5% decrease in total dollars across these two buckets. These invoices now only account for 6% of both number of invoices and total dollars outstanding. While this percentage is unusually high, we are definitely seeing progress in this category, and the start of this week has seen several more of these invoices getting paid off which should lead to more good news next week.
State-by-State
Once again, it appears that businesses in states that have taken greater precautions in preventing the spread of COVID-19, have not only outperformed those in states that were less precautious, but that business in these states has indeed returned to normal levels. Whether we compare states that closed either before or after March 28th, states that reopened either before or after May 9th, or states that were experiencing surging COVID-19 rates as of June 23rd to those that were remaining stable or declining, businesses in states that took a stronger stance against the virus and managed it better are outperforming their peers.
When we look at states that implements stay-at-home orders prior to March 28th, we can see that from March 28th through May 9th, businesses in these states operated at 74% of normal levels, and since May 9th have been operating at 98% of normal levels. Businesses in states that didn’t implement orders until after March 28th on the other hand, only operated at 22% of normal levels prior to May 9th, and 69% of normal levels after May 9th.
Looking at states that began reopening prior to May 9th, businesses in these states were operating at 25% of normal levels prior to May 9th, and have been operating at 51% since May 9th. However, businesses in states that waited until after May 9th to reopen have fared much better, operating at 61% before May 9th, and 102% since May 9th.
Unfortunately, at this time COVID-19 cases appear to be surging across the country, including in states that seemed to have gotten the virus under control over the past two months. However, with approximately half the states surging as of June 23rd, that still seems an appropriate date to use for making comparisons. Businesses in states that were surging had been operating at 49% of normal levels prior to May 9th, and at 64% after May 9th. While businesses in states that weren’t surging as of June 23rd actually fared worse prior to May 9th, only operating at 44% of normal levels, but have done much better since May 9th, operating at 118% of normal levels.
What is most interesting is the progression we see from states that were first to close, to states that waited longer to reopen, to states that appeared to have the virus under control. The businesses in these states seemed to do progressively better in each comparison, which would indicate that taking the measures necessary to contain the virus is actually in the best interest of businesses, even if it means that they may not be operate for an extended period of time or forced to operate at reduced capacities. The fact that states that weren’t surging as of June 23rd have gone from worse to much better than their peers, shows that regardless of how the state tackled the virus early on, what matters most is what they are doing now to contain it. In other words, every state who acts appropriately now to contain the virus should be able to strengthen their economy, regardless of how they handled the pandemic in the past. Clearly consumers feel more confident spending their money when there is less risk of getting sick in the process.
While the economy hasn’t returned to normal yet, it does appear that it may have returned to normal in the states that have acted responsibly in controlling the COVID-19 pandemic. It also appears that the economy may have reached a level that could be considered a “new normal” at least until a vaccine becomes available. Of course, if states that are experiencing surges right now, such as Florida, Texas, and Arizona, can get the virus under control, it is quite possible that the economy could experience a full recovery. Only time will tell if this is indeed the case.
- America
- Small Business

June 24, 2020
Categories:
Economy Remains Strong as COVID-19 Cases Surge Around the Country
Once again we are continuing to see strong numbers from our data, although the numbers seem to be remaining stable now. This is still very good news as the economy has recovered immensely over the past few weeks and is approaching normal levels. However, with outbreaks spreading across the South and West, we are starting to see the economy slip in these regions. It will be interesting to see what the economy does over the next few weeks, especially if businesses may be forced to close their doors once again.
Purchase Orders
The number of credit approval requests we received this week hasn’t really changed much from the past two weeks, and are at a very acceptable 78% of normal levels, following 76% the week before and 81% the week before that. The big change was that total dollars jumped considerably to almost 150% of normal levels. While this may sound like fantastic news, it is entirely due to a single extremely large purchase order that we received. If we remove that one purchase order, total dollars for the week would be at 89% of normal levels, which also falls right in the middle of the numbers from the previous two weeks. This huge difference demonstrates just how much of an impact major retailers can have on the total dollars, but the relatively large number of approval requests does indeed that many small businesses are once again ordering.
Purchases
Purchases jumped this week to 122% of normal levels, however, this is mainly due to the fact that we purchased about three quarters of that very large purchase order we received this week. If we exclude this one very large purchase, purchases were only at 68% of normal levels. While that number is significantly lower than the 76% and 88% numbers we saw the previous two weeks, it is still much improved over what we saw at the height of the lockdowns. These numbers also seem to fluctuate wildly so a low number for one week isn’t really a cause for concern.
Payables
Once again payables look to be headed in the right direction and are growing significantly. Our total dollars outstanding the week are up nearly 16%. Now of course that includes the one very large PO, but even we exclude that, total outstanding is still up 3%, marking the 4th straight week of positive growth. Also growing are the total number of outstanding receivables which are up 7%, and the total number of accounts with a balance which is up 9%. Of course, all of this occurred as many older invoices continued to get paid off.
The number of invoices that are current grew by nearly 14% this week. Current invoices now account for 72.5% of all outstanding invoices, when normally they would only account for around 66% of all outstanding invoices. Current dollars grew by 25% this week, and if we were to eliminate that one large order they still would have grown by 8.5%. Current invoices now account for 85% of total outstanding dollars, way above the normal level of 77%. Most likely these unusually high percentage are due to the economy picking up after being quiet for so long. It will be interesting to see if these numbers are able to hold steady over the next 30 days.
The number of invoices in the 1-30 days late bucket actually grew slightly this week, however, they make up a slightly smaller percent of all outstanding invoices, still accounting for about 17.5% of all outstanding invoices. Meanwhile the total dollars in the 1-30 days late bucket dropped by 25% this week, and they now account for less than 7% of total outstanding dollars. Last week these invoices accounted for 10% of total outstanding dollars, and normally they would account for approximately 15% of total outstanding dollars. This huge decrease is due to invoices being paid for in a very timely manner, they are not aging out of this bucket.
This leads us to the 31-60 days beyond terms bucket. Once again, we saw a drastic decrease in this bucket. We saw 37% of these invoices which accounted for 59% of all dollars in this bucket get paid for in the last week. These invoices now account for only 2.7% of all outstanding invoices, which is down from a high of 23% from 6 weeks ago. 2.7% would actually be on the low side of what would be considered normal for this bucket. These invoices also account for less than 1% of total dollars outstanding, down from a high of 12% also from 6 weeks ago. Once again, this number would be on the low side of what is considered normal. All of these invoices would have been created after the initial stay-at-home orders went into effect, although it is possible that some of the orders would have predated the pandemic.
The more worrisome numbers are coming from invoices that are more than 61 days beyond terms. These numbers haven’t really changed any from last week, although a quarter of the invoices that were 61-90 days beyond terms last week, have now aged into the 91 days or more beyond terms bucket. These invoices still account for about 7.5% of all invoices and all dollars outstanding, while normally they would only be 3-4%. Of course, that 7.5% is a little inflated as we are only at approximately 78% of normal total volume. A large percentage of these invoices are coming from clothing stores, hotels, and restaurants, industries that were particularly hard hit by the stay-at-home orders.
State-by-State
Since we started doing state-by-state analysis of our data we have been sounding a lot like a scratched record, the states that opened prior to May 9th are fairing much worse than the states that waited later to reopen. Now as COVID-19 cases are surging across the country, we are actually seeing the economies of states that opened early start to slow down again, while those that waited longer continue to pick up steam. Furthermore, businesses in states that reopened early are still twice as likely to be past due than those in states that waited longer to reopen. However, our new discovery this week comes from comparing states that have managed to control the pandemic to those that are seeing a surge in cases.
As we mentioned, states that reopened earlier accounted for 40% of our volume prior to the pandemic, and slipped down to 21% of our volume at the height of sty-at-home orders. After reopening they started to gradually improve and last week we reported that their share of total volume increased by 3% since April 24th and 6% since May 9th. However, as many of these states have been hit by a surge in cases, those gains have all been pretty much wiped out. In just one week they lost all the gains they made since April 24th, and have now only gained 2% since May 9th. The reason behind this is that their total volume simply isn’t growing as quickly as total volume in states that waited longer to reopen. Since May 9th, states that reopened early are now at 49% of normal volumes, up from 25% prior to that. Meanwhile, states that reopened later are now at 104% of normal volumes since May 9th, up from 60% prior to that. Overall, the country is at 84% of normal levels, up from 47% prior to May 9th.
This week, given the huge surge in COVID-19 cases, we decided to compare states that are surging to those that are either improving or staying the same. It probably won’t come as a surprise that the states that are not seeing a surge in cases are doing much better economically. The states that are surging are currently doing 63% of their normal volume, up from 49% during the height of stay-at-home orders, while the states that are improving or staying steady are doing 122% of their normal volume, up from 44% during the height of stay-at-home orders. Of course, these numbers are both much higher than the numbers above, but that is due to the fact that many of the larger states, including California, Texas, and Florida, are states that are surging. Combining these numbers you still wind up at the same 84% for the country.
Since we can see such a large difference between states that are surging and states that aren’t, it probably would make sense to see if there was a similar trend at the start of the pandemic. To do this, we will compare states that issued stay at home orders prior to March 28th, to those that waited longer or never issued stay-at-home orders. Interestingly, both of these groups accounted for 50% of our volume prior to the pandemic. During stay-at-home orders, the states that were quicker to enact orders saw their volume reduced to 74% of normal levels during the stay-at-home orders, but that volume has since recovered to 96% of normal levels as stay-at-home orders began to get lifted. However, in states that waited to enact orders, their volume dropped down to 22% of normal levels immediately after California issued the first stay-at-home orders. As stay-at-home orders began to get lifted, these states saw their volume improve to 72% of normal levels.
What’s interesting is that states that reopened earlier clearly did so because their local economies were completely destroyed by the pandemic. However, when we compare the states that are surging to the ones that aren’t, we can see that their economies were pretty much the same during stay-at-home orders. Whether or not a state chose to reopen early or not does not correlate with whether there is a surge in the state. While Texas, Florida, and Georgia all reopened early and are experiencing surges, California waited to reopen but are still experiencing a surge. Furthermore, Indiana, Colorado, and Maine reopened early, yet the number of cases in those states is either staying steady or declining. We also saw that the states that acted sooner in issuing stay-at-home orders also fared much better during the lockdown, and have continued to do better since. From the data above we can see that consumers are definitely concerned about their health, and are more willing to spend money if they live in a state that is taking greater precautions to minimize the spread of disease. As states continue to open up more and more, if that reopening up leads to a surge in cases, then there is very little to be gained economically from the reopening. However, if the reopening is done responsibly, the economy can thrive even if many restrictions are still in place.
Certainly, there is a lot of information that can be learned from the data, and as the situation in both the country and each state changes, we are seeing some very interesting things happen. Here at DSA Factors we will continue monitoring and reporting on our data for as long as we need to. Let’s hope that we won’t need to do so for too much longer.
- America
- Financing
- Fintech
- Insurance
- Retail
- Small Business

June 19, 2020
Categories:
The Dangers of Supply Chain Finance in the COVID-19 Era
Supply Chain Finance has been gaining in popularity over the past few years. Instead of forcing vendors to wait 30 or 60 days to get paid for their receivables, retailers have discovered that they can get a several percent discount in exchange for paying their vendors early. It seemed like a win-win, vendors get the cash flow they need, and large retailers get a discount at a rate that far exceeds interest rates. Of course, all of this changed over the past few months as our nation, and the world, have been gripped by the COVID-19 pandemic.
Suddenly, retailers have been forced to shut their doors with no plan for when they may be able to reopen. While their customers have been laid off, furloughed, or taken pay cuts, and those who have managed to maintain their jobs are more concerned with purchasing essentials and saving money in case they too become an economic casualty of the COVID-19 pandemic. Not to mention, many consumers simply don’t feel safe leaving their homes for anything that isn’t essential. As a result, these retailers have found it best to hold onto their money for as long as they can, and most have either extended payment terms (with or without permission) or are simply paying invoices well beyond the due date. For small vendors that have relied on supply chain finance, they now find themselves in a very difficult position.
One of the major retailers who offers supply chain financing is TJX (TJ Maxx, Marshalls, Homegoods). When stay at home orders were first issued, TJX told all their vendors that they would be extending terms on all of their invoices from 30 to 90 days, although they reversed that decision a couple weeks later due to the backlash they received from the vendors. However, by that point the damage had already been done. Many vendors were unable to get the early payment they rely on, and due to the closure of their corporate headquarters and a need to catch up, many invoices were still paid well beyond terms. Companies that were used to getting paid within 5-10 days were now waiting 45 days to get paid, and this was at a time when sales had pretty much dried up. It also appears that for the immediate future, any new orders from TJX will have terms of 90 days, making it unlikely that they would be willing to offer early payment. Unfortunately, TJX was far from the only major retailer to extend terms or simply fall behind on their bills.
Of course, it also isn’t just an issue of cash flow anymore, the COVID-19 pandemic has proven to be just as deadly for businesses as it is for the people it infects. While all non-essential businesses had been forced to close their doors temporarily to flatten the curve, many of these businesses will be closing them permanently as a result of no revenue but continuing expenses. If the retail apocalypse wasn’t bad enough before the pandemic, the recent wave of bankruptcies has been incredible. Already we have seen J.C. Penney, Neiman Marcus, J. Crew, Stage Stores, and True Religion have all filed bankruptcy during the pandemic. Lord and Taylor has avoided bankruptcy, but has announced they will be holding going out of business sales as soon as they are allowed to reopen. L Brands (Victoria’s Secret, Bath and Body Works) will not be filing, but will be permanently closing 250 stores. While Pier 1 Imports and Art Van Furniture, both who filed bankruptcy prior to stay-at-home orders being issued, were forced to change their bankruptcy plans and completely liquidate. Of course, the retail sector is far from the only industry being hit with bankruptcies, hospitality, entertainment, and health clubs have also been filing for bankruptcy at an incredible rate. Sadly, these companies are only the beginning, with many more considering their options as well.
Even worse, the dangers of bankruptcy are actually compounded by supply chain finance. Many businesses don’t feel the need to carry credit insurance if their customers offer supply chain financing. The logic behind this is that there is no risk if a company is paying them early. However, the decision to pay early is entirely up to the customer, as is the amount of the discount that they will take. Prior to filing for bankruptcy in 2017, Toys’R’Us utilized the popular C2FO platform for supply chain financing. Towards the end they started demanding larger and larger discounts in return for early payments. Further complicating matters is US bankruptcy law in regards to receiving preferential payment. When a company files for bankruptcy, the bankruptcy court can demand that any preferential payments made within 90 days of the filing be returned to the court. When a vendor offers a discount in exchange for an early payment, there is no question that the vendor has received a preferential payment and will be forced to return the payment to the court. So vendors that offered double digit discounts that Toys’R’Us accepted, ultimately would have had to return the funds if they were received within 90 days of the filing. Had they waited until the invoice was due and gotten paid in full, they probably would have been able to keep their money.
With many businesses reopening at this time, there is still a question of how many of them will be able to survive. With consumers spending less money these days, and spending in unpredictable ways, combined with a fear of whether it is even safe to go out in public, revenues will continue to remain low for the foreseeable future. Yet these companies will need to rehire much of their workforce and continue to make rent, pay utilities, and interest payments on debt. For businesses such as restaurants and movie theaters, who will need to reopen at reduced capacities, there is a question as to whether or not they will be able to remain profitable. Unfortunately, most experts are predicting that even though businesses are starting to reopen now, many businesses that have survived so far might not make it through to the end of the year. Even with companies that emerge from the lockdowns with strong sales, there is still the question of whether or not they would be willing to pay invoices quicker, the current trend is that most companies are requesting longer payment terms. Of course, none of this takes into account the possibility of a second wave of infections and subsequent closures.
Relying on supply chain financing to improve your cash flow may have worked for the last few years, but it is doubtful that it will be as reliable moving forward. Furthermore, wholesalers need to be more careful than ever about who they are selling to. The only thing worse than getting paid slowly is not getting paid at all. Paying for credit insurance on top of supply chain financing can be extremely costly, especially for businesses that do less than $10 million a year. Not to mention, the credit insurance companies have been hesitant to take on new clients, and have slashed credit limits across the board for their existing clients.
There is a solution to this problem, and that is accounts receivable factoring. With accounts receivable factoring you sell your receivables to a factoring company, and can be funded the same day you ship the merchandise, making it a much quicker turnaround than supply chain finance. Furthermore, your factoring company is responsible for monitoring your customers and establishing appropriate credit limits. If the factoring company offers non-recourse factoring, then not only do you receive improved cash flow, but they also insure your receivables, eliminating the need for costly credit insurance. Just like supply chain finance, when you factor your receivables you are not taking on any new debt as your factoring company is purchasing your receivables from you. The best part, however, is that accounts receivable factoring is available for all of your accounts and costs no more than supply chain financing. Plus, since factoring rates are fixed, it takes away all the guess work associated with supply chain finance and can easily get built into your margins. Want to learn how easy it is to improve your cash flow with accounts receivable factoring? Give DSA Factors a call today at 773-248-9000 and we will be happy to speak with you.
- America
- Small Business

June 17, 2020
Categories:
Another Strong Week as the Economy Returns to Normal During the COVID-19 Pandemic
Last week we had reported our strongest week yet since stay-at-home orders were implemented to slow the transmittal of COVID-19. While this week’s data isn’t quite as strong as last week's, it is still stronger than any other week’s data that we have seen throughout the pandemic, and a very strong sign that the economy is recovering to near normal levels.
Purchase Orders
This week we saw a very minor decline in the number of approval requests we received. With the number of requests falling to 76% of normal levels from last weeks 81%. Meanwhile total dollars had dropped from 101% of normal levels last week to 78% of normal levels this week. The drastic decline in total dollars compared with the minor decline in number of requests would imply that our clients received fewer purchase orders from major retailers than they had the previous week, although purchase orders from small businesses would have remained steady. Of course, last week’s data was coming on the heels of poor data the previous week, so it is quite possible that last week’s data could be the result of slow reporting of the previous weeks data. Regardless, the data we collected this week is very promising, and while it is too low to be considered within a normal range of fluctuation, it is a very promising sign that the economy is headed in the right direction.
Purchases
Purchases have been harder to gauge as they seem to fluctuate wildly from week to week. However last week we reported purchases reached 76% of normal levels which was our second strongest week yet, and the only stronger week being early on in the pandemic when we had several very large purchases from major retailers, all from purchase orders placed prior to the pandemic. This week purchase levels reached 88% of normal levels, which is nearly a 250% increase over the lows we experienced just one month ago. In fact, purchases have now increased in 4 of the last 5 weeks since we experienced that low.
Payables
Payables are continuing on their path to recovery. It appears that the businesses who are placing orders are in a position to get them paid off promptly, and the vast majority of businesses who placed orders just prior to the start of the pandemic have now paid for those orders. However, it does appear that businesses that were struggling prior to the pandemic are still struggling as very few of them are making progress in paying off their old invoices.
Total outstanding dollars are up again for the third straight week, this time increasing by 3% after increase of 2% and 1% in the previous two weeks. This increase has also coincided with over a third of very past due invoices being paid off over the same period. When looking at current dollars, they climbed nearly 6% this week after they climbed by 13% last week, which was the first time we started to see them rise. 79% of all dollars are now current, which is the highest level we have seen yet, and slightly better than what would be considered normal.
In terms of number of outstanding invoices, we have seen much more dramatic increases. They rose by 12% this week after climbing by 4.5% the week before. The number of accounts with outstanding invoices grew in a similar way, climbing 15% this week after a 7% climb last week. The inverse relationship between the growth in number of invoices and accounts compared to total dollars would suggest that much of the business that occurred over this past week had been with small businesses. At this point, nearly 70% of outstanding invoices are current, which is significantly above the 66% that would be considered normal.
This week only 17.5% of all receivables are now 1-30 days beyond terms, and they account for 10% of total outstanding dollars. Neither of these numbers have really changed much from last week, but they are still well below normal levels. This would seem to imply that only businesses that can afford to pay for their merchandise in a timely fashion have been placing orders during the pandemic. However, what we don’t know is if this is due to these businesses seeing an uptick in sales, or if they are simply strong financially and confident in their ability to recover.
Another very promising sign is what is happening with receivables that are 31-60 days beyond terms. 39% of these receivables and 47% of the total dollars in this category have gotten paid off over the last week. At this point, almost all of these invoices would have been created during the pandemic, although it is possible that some of the orders were placed just prior to the start of the pandemic. We saw the number in this aging bucket peak just 5 weeks ago when they accounted for 23% of all outstanding invoices and 12% of all outstanding dollars. Today they only account for 4.6% of all invoices and 2.5% of all dollars. We have experienced an 81% decrease in both the number of receivables and total dollars in this category over this 5 week period. Of course, the invoices in this category 5 weeks ago would now all be in the 61-90 days past due category, and the invoices in this category today would have been in the 1-30 days past due category 5 weeks ago. However, 5 weeks ago invoices that were 1-30 days beyond terms made up 33% of all invoices and 17.5% of all dollars. That is a pretty drastic improvement, and while these numbers may still be a little high, they are only maybe 1% off from normal levels.
That of course brings us to invoices that are more than 61 days beyond terms. The good news and the bad news is that the number of invoices and total dollars in this category has not changed significantly over any of the previous 5 weeks. While the bad news would be that newer invoices have aged into this category over the past 5 weeks, the good news is that an equal number of invoices have been paid from this category over the same 5 weeks. In other words, invoices that were problematic 5 weeks ago are less problematic today, but there are an equal number of new invoices that have since become problematic. It is important to keep in mind that the invoices that are 61-90 days past due would have all been created prior to the first stay-at-home orders, but would have become due after the orders were issued. The vast majority of the accounts in this category are for clothing retailers, including major department stores, and businesses in hospitality such as restaurants and hotels. Nearly all of the invoices that are more than 90 days beyond terms, were already severely past due when businesses were forced to shut down, many of which were on payment plans that they have failed to keep up with as a result of the pandemic.
State-by-State
Once again, for the states that reopened early, prior to May 9th, their economy seems to be trailing behind the economies of states who waited longer to reopen. While they are doing slightly better after this last week, we have only seen their percentage of total volume climb by 3% since April 24th, when Georgia reopened, and by 6% since May 9th, after having dropped by 20% during the height of stay-at-home orders. While all states are recovering, the recovery is happening quicker in states that waited longer to reopen. The states that reopened early are now operating at 44% of normal levels, up from 25% during stay-at-home orders, while states that waited longer to reopen are now at 88% of normal levels, up from 60% during stay-at-home orders.
It has also become clear that businesses in states the reopened early are having a more difficult time paying down their balances. While businesses in these states had the upper hand initially after their states reopened, now that pretty much every state has reopened to some extent, businesses in states that reopened later are doing a better job of catching up on past due invoices. Only 2% of invoices that pre-date stay-at-home orders are still open in states that waited longer to reopen, but 5% of these invoices are still outstanding in states that reopened early. While the states that reopened early accounted for 40% of our volume prior to the pandemic, they now account for 60% of all open invoices that date back to before the pandemic.
The decision on when to reopen appears to have been made heavily on the state of the local economy in each state, but it certainly does not appear to be the case that reopening earlier has had much of a positive effect on the states that chose to do so. Rather it seems that how strong a local economy was during stay-at-home orders has a direct correlation to how quickly that economy has been able to recover. In the meantime, it is becoming very clear that reopening has led to a surge in COVID-19 cases, even in states that waited longer to reopen. While it was major cities and their suburbs that were hit the hardest early on, some of the highest rates of infection are now occurring in small towns and rural areas. If states are forced to close again, it could be devastating for the businesses that are just starting to bounce back from the first lockdown. DSA Factors will continue to monitor and report on the situation as it continues to evolve.
- America
- Small Business

June 10, 2020
Categories:
Major Economic Improvements This Week as Businesses Start to Return to Normal
We reported last week that we saw a slight slowdown in the recovery of our nation’s economy. But our data from this week suggests that is most likely an outlier, or possibly just a slight delay in receiving this week’s data to analyze. For the first time since stay-at-home orders were issued at the end of March, we are now seeing data that appears to be at near normal levels. This of course reflects the larger picture that has emerged in the national news with unemployment levels falling in May and the stock market bouncing back to pre-pandemic levels. But it also comes during a week of large, organized protests all across the country, and looting that has occurred in many cities and suburban areas.
Purchase Orders
Last week we saw the number of credit approval requests and the total dollars requested return to pre-pandemic levels. The number of credit approvals requested was at 81% of average, which is well within a normal level of fluctuation that we see week to week. In terms of dollars, they were at 101% of average. While it is certainly possible that this week’s data could be an outlier, or it could be that some purchase orders that came in the previous week didn’t get submitted to us in a timely fashion, there is no question that this is indeed good news. The highest numbers that we had seen for requests and dollars were only 52% and 78% respectively. We haven’t seen numbers like this since the week ending March 20th. Now it is a little concerning that the percentage for number of requests is much lower than the percentage for dollars requested, as this would imply the major retailers are accounting for the majority of the volume. But just how drastically both these numbers have improved over the last week would imply that many small businesses are recovering as well.
Purchases
Purchases have been fluctuating wildly from week to week which makes them a lot harder to read. This past week purchases reached 76% of normal levels, their second highest level since the pandemic began. The week with a higher percentage was mainly due to several very large orders being invoiced to major retailers in the same week, these large orders were all placed prior to the pandemic. This week’s data does not appear to have any unusually large orders, meaning that it shows great improvement all around, and not just for a few major retailers. More good news is that over the last month we have seen purchases levels fluctuate between 44-76% with an average of 60%, earlier in the pandemic they were fluctuating between 36-62% with an average of 48%, excluding the one week that was clearly an outlier. So, while these numbers may be difficult to gauge, they are clearly improving.
Payables
Payables have been returning to normal over the last month, and continue to reflect that. We’ve seen total dollars outstanding increase for the second straight week, and the total number of receivables outstanding increase for the very first time since the outbreak of the COVID-19 pandemic. Total outstanding dollars are up another 2% this week, after climbing by 1% last week. While this may seem small, it is significant considering that they had been dropping an average of 7% per week prior to that. This combines with a 4.5% increase in total number of receivables outstanding, and a 7.2% increase in the number of accounts with outstanding balances. Prior to this week, those numbers had been declining by 13.4% and 11.1% per week respectively.
Of course, all of this positive change would be meaningless if older receivables weren’t getting paid, but it turns out while we are seeing these increases, we are actually seeing even more of older receivables getting paid off. The number of receivables that are current now account for 65% of all outstanding receivables, while 77% of total outstanding dollars are now current. Both of these numbers have increased by 7% over last weeks number and are at levels that we would consider perfectly normal.
As for past due receivables, the total number of them has dropped by 12% from last week, while total dollars have dropped by 23%. While these numbers have been dropping throughout the pandemic, the total number has only been declining by an average of 6.5% per week, and dollars have been declining by 3.5% per week, with last week seeing an increase in total dollars past due of 4%. This is a very clear indication that older orders are being paid for and new orders are being placed.
At this point 18% of all receivables are now 1-30 days beyond terms, and they account for 10% of total outstanding dollars. Both of these numbers are not only improvements over last week, but they are also well below normal levels. This could mean two possible things. First it might mean that companies are taking less time to pay their bills, or alternatively it could mean that only companies that are strong financially had been placing orders during the pandemic as the majority of these invoices are from April and a small portion of them from early May.
Meanwhile the number of invoices that are 31-60 days late have dropped from 14.5% of all receivables to 8.5% of all receivables over the last week, and they now account for less than 5% of total outstanding dollars, and improvement of 3.5%. These are receivables that would have been become due between early April and early May for orders that were placed prior to the start of the pandemic. While these numbers are higher than normal, it is certainly understandable that these would be the orders that are most difficult to pay for as the retailers would not have had much, if any, of a chance to sell the merchandise before being forced to close their doors. It is a very encouraging sign that these numbers are continuing to drop.
We have seen a slight increase in the number of receivables that are more than 61 days past due as there are now 3% more than there were last week, and their dollar value actually increased by 12%. However, a handful of these invoices did get paid off, it’s just that more invoices have aged into this bucket since last week. At this point 9% of all invoices are 61 days or more beyond terms, and they account for 8% of total outstanding dollars. This is the first time since the pandemic began that we have seen more invoices and dollars in the 61+ bucket than we have in the 31-60 bucket. It is only further proof that companies that were struggling before the pandemic, and struggling now even more.
State-by-State
Again, we will compare states that reopened early, prior to May 9th, with those that reopened later. We have already noticed that the states that were first to reopen are the states that had their economies hit the heaviest by the COVID-19 pandemic, and that reopening had not done much to revive their staggering economies. Sadly, despite the huge uptick we saw across all the above categories this past week, we actually saw numbers slip in the states that reopened earlier, with drastic gains in the states that waited longer to reopen.
While purchases may have been way up overall this past week, it appears that all of these gains occurred in states that waited longer to reopen. We saw a 50% increase in purchases in states that waited longer to reopen, and a 25% decrease in states that reopened earlier. While these purchase numbers have been fluctuating wildly throughout the pandemic, both of these numbers are beyond the normal fluctuations that we have been seeing from week to week.
The other noticeable change we saw this week is in past due invoices. It has been the case for the last month that businesses in states that reopened earlier were less likely to be past due than businesses that waited longer to reopen. While the gap between these two groups had been narrowing, this week we saw the gap flip, and businesses in states that reopened later are now 1% less likely to be past due than businesses in states that reopened earlier.
Overall, it looks like our economy is headed on the right track and may even be improving much faster than many experts predicted. Of course, we still have a long way to go, and geography appears to be playing a significant role in whether businesses have been able to recover. We will continue to monitor the situation each week and keep you informed until the economy recovers from the COVID-19 pandemic.
- America
- Small Business

June 3, 2020
Categories:
A Slowdown in the Recovery Prior to the Civil Unrest
After four straight weeks of economic improvement, this past week saw a slight setback. While all numbers were down over this past week, they weren’t down by a lot and are still much improved over what we saw at the end of March and throughout all of April.
Purchase Orders
This past week saw the fewest number of credit approval requests that we have seen since the end of April. However, while they may be down 18% from last week, they are still up over 50% from the last week of April, and up 72% from their low point which occurred the first week of April. In terms of total dollars being requested, they are the lowest they’ve been in 2 weeks. We saw a 25% drop from last week, but that is still a 69% improvement over the low that occurred in the third week of April. While we hate to see a step backwards, the previous four weeks have shown tremendous growth and we are still much improved over the lows that came at the height of the COVID-19 shutdown. So far the data for this week is looking incredibly positive, but it is quite possible that many of these credit approval requests were for orders placed before the weekend’s violence. We will have to wait probably another two weeks to see how the economy is affected by the rioting that has occurred.
Purchases
As we have stated, purchases have been fluctuating wildly in both directions each week. Last week we saw positive growth for consecutive weeks for the very first time, but unfortunately that growth has not been sustained this week. Purchases this week dipped down to 44% of normal levels after having been a little over 60% the previous week. However, this is still a drastic improvement over what we saw in the final week of March, all of April, and even the first week of May.
Payables
For the first time since we started tracking outstanding receivables on April 1st, we actually experienced an increase for the very first time in total dollars outstanding, even if it only was a 1% increase. However, the number of open receivables and accounts with balances both continued to drop. The number of accounts with open receivables dropped 2.5% this week and are now exactly half of the number of open accounts we had on April 1st. While this is certainly positive sign that many businesses have been able to pay their debts from before the COVID-19 pandemic, it is upsetting that very few of them have been able to place new orders.
As for percent of receivables that are current, we saw an increase of 3% from last week to 58% of all invoices, continuing a trend of growth that has been going on for the past 4 weeks. However, in terms of total dollars we actually saw a decrease of half of one percent this week, marking the first time we have seen a decrease since the end of April, and putting total dollars that are current at just below 70%. This is rather surprising given that total dollars outstanding actually grew over the last week since any growth would have to be attributed to new receivables being purchased. However, it appears that much of the growth over the last week or two may be attributable to small businesses that are reopening, and the major retailers have slowed down their ordering as consumers have stopped hording many products. Their large orders from earlier in the pandemic are aging and are no longer current.
There was no change from last week in the number of receivables that are 1-30 days beyond terms, marking the first time these numbers haven’t declined since the first week of April. However, while the number of receivables remained steady, the total dollars increased by 25%. This is rather shocking given that last week they decreased by 40% and this is the first time since the second week of April that we have seen an increase. Receivables 1-30 days old account for 14.5% of all outstanding dollars, which is actually normal. This of course is great news as it means that payables for retailers are returning to normal.
Despite these increases in receivables 1-30 days beyond terms, we are still seeing decreases across the board in receivables that are more than 30 days beyond terms. We have 16% fewer receivables that are more than 30 days late, and they account for 10% less total dollars than they had the week before. The vast majority of this improvement was seen in invoices that are 31-60 days late, which are mainly for orders placed before stay-at-home orders were issued, but became due after they were issued. However, we did also see slight improvements in invoices that are 61-90 days or more than 90 days late, all of which were already past due prior to the first stay-at-home orders being issued. Invoices that are more than 30 days late still account for 23% of all invoices and 16% of total dollars outstanding, under normal conditions these numbers would be 7% and 6% respectively. However, this is the third straight week of positive improvement in the category, so we are optimistic that these very past due invoices will start getting paid down as well.
State-by-State
Once again, we will be comparing states that reopened early, prior to May 9th, to those that reopened afterwards. As has been discussed before, the states that reopened early are the states whose economies were the hardest hit, and once again it seems like these states are still struggling to recover as quickly as states that have proceeded with more caution.
The states that reopened early have now accounted for 17% of our total volume in the weeks since reopening, which is a large improvement over 14%, 11%, and 7% in the three weeks prior. However, this is still a far cry from the 40% of volume that they normally account for and even the 23% that they accounted for during the weeks that stay-at-home orders were kept in place. This isn’t all bad news however, the volume we are doing with businesses in these states does appear to be steadily increasing each week, it just isn’t increasing at the same rate as businesses in states that waited longer to reopen. In fact, business has indeed improved each and every week since Georgia became the first state to reopen in states that reopened early. In the states that waited longer, we are seeing lots of fluctuations in their business volume, but they experienced a drastic increase as soon as Georgia reopened and have remained way above the levels that they were at prior to that.
As for payables, businesses in states that reopened early did indeed have an easier time paying their bills after they were allowed to reopen and were 6% less likely to be past due a few weeks ago. However, now that most every business has been allowed to reopen at some capacity, the businesses in states that reopened early are only 2% less likely to be past due. However, because businesses in these states have seen much larger declines in volume since the pandemic, they have much fewer current invoices, and the vast majority of what is outstanding is indeed beyond terms, meanwhile the vast majority of what is outstanding in states that waited longer to reopen is now current.
Business is certainly improving from its low points at the height of the COVID-19 pandemic back in April. More and more states are easing restrictions, and many school districts are discussing plans for reopening in the fall. However, last weekend and the beginning of this week have been plagued by civil unrest that has unfortunately damaged many businesses that were just starting to reopen. Only time will tell what impact this has on the economy, and even worse, if it will also set us back in our fight against COVID-19. DSA Factors as always will continue to monitor our data and keep you informed on the state of small business in America.
- America
- Small Business

May 28, 2020
Categories:
Small Businesses Recovering Financially, but Not Generating New Sales
Last week didn’t just bring us our fourth straight week of positive trends, but actually shows that most small retailers have recovered financially as well. While this is certainly very positive news, unfortunately small retailers aren’t out of the woods yet. While they may have the funds necessary to pay existing bills, it is quite possible that many have done so thanks to loans they received via the second round of the Paycheck Protection Program (PPP). Unfortunately, they still are not placing new orders, which means that they aren’t generating new sales. With millions of Americans still out of work, we will have to wait to see if many of the retailers who survived the pandemic will be able to survive the recession that follows it.
Purchase Orders
This week marks four straight weeks of positive growth, but not by much. Credit approval requests only increased by 1% over the previous week after last weeks improvement of 11%. The good news here is that even though it may not have increased by much, it is at least holding steady at just over half of normal levels and not dropping. On the other hand, total dollars requested increased by 20% and are now at nearly 75% of normal levels. Once again, the large disparity between these two measurement would suggest that major retailers are still doing the vast majority of the business while small businesses are still struggling.
Purchases
Purchases seemed to be fluctuating wildly in both directions each and every week and have therefore been a little bit harder to gauge. However, last week marked the first time that we had positive growth in purchases with a 2% increase bringing us up to 60% of normal levels. With the large increase in dollars being requested for credit approval last week, hopefully we will see a larger increase in purchases next week.
Payables
Payables are presenting us the most positive news yet. Not only is this the fourth straight week of improvement, but we have seen improvements across all aging buckets for the very first time. Much of this can be attributed to total outstanding receivables dropping by nearly 15% last week despite having a relatively good week for purchases. Even more optimistic is the fact that we are now only several percentage points away from having an aging report that looks to be normal.
The percent of current receivables has grown by a little over 10% this past week, after improvements of 8%, 3%, and 2% over the last few weeks. Current receivables now account 55% of all receivables. While a normal level would be around 65%, this is a huge improvement over the low we reached of only 31% exactly one month ago. As for total dollars that are current, we saw a 7% improvement. This is a huge improvement as the previous three weeks only had improvements of 1%, 2%, and 1%. Now just a little over 70% of all dollars are current. Normal levels would be around 78% and our low point was 58% which occurred back in mid-April.
The most interesting data comes from receivables that have just became due. Invoices that are less than 30 days beyond terms dropped by 35% and now only account for 18% of all receivables while they would normally account for 27%. Total dollars that are less than 30 days beyond termed dropped an amazing 40% since last week. They now account for 12% of all outstanding dollars, while normally they would be around 15%. The reason for these slightly late receivables being better than normal may be because all of these orders would have been placed after stay-at-home orders went into effect. So, the businesses placing these orders were aware of the restrictions in place yet still had the confidence that they would be able to sell this merchandise and pay for it in a timely fashion. Another explanation for this is that major retailers tend to pay faster than small businesses, and major retailers have been doing a lot more business than smaller businesses since the start of the COVID-19 pandemic.
Now the really good news is coming from receivables that are more than thirty days beyond terms. While we had been seeing the numbers for newer receivables trending in the right direction for several weeks now, the numbers for these older receivables have been fluctuating up and down with the previous two weeks being the worst ones yet for these very past due receivables. Luckily this week, even these extremely past due receivables are starting to improve. It is also important to note, that at this point, all of these orders would have been placed prior to the first stay-at-home orders being issued.
The number of receivables that are 31-60 days old have dropped by 25%, although they still make up over 18% of all receivables, while normally they would only account for 3%. In terms of dollars, they fell by 22%. They still account for 10% of all outstanding dollars, while normally they would just be 1%. It is important to keep in mind that all of these orders were placed prior to stay-at-home orders, but would have been become due once stay-at-home orders were put in place. As a result the retailers that fall into this aging bucket didn’t really have too much of an opportunity to sell the merchandise before being shut down.
For invoices that are more than 60 days beyond terms we also saw some pretty significant drops. About 8% of these invoices have been paid over the last week, but that accounted for 18% of total dollars owed. At this point, these are all invoices that became due prior to the first stay-at-home orders, meaning these businesses were all past due prior to the start of the COVID-19 pandemic. While these very past due invoices had remained fairly steady throughout most of the pandemic, they started growing quickly over the previous two weeks, that is because many of these invoices were still in the 31-60 day late bucket up until a week or two ago. While the number of very past due invoices is still very high, they only account for 8% of our total outstanding receivables when normally they would be about half that amount.
State-by-State
As we did last week, we will once again be comparing states that reopened early, prior to May 9th, to those that reopened afterwards. As we have mentioned before it appears that the decision to reopen has largely been driven by the local economy and not necessarily on the ability to contain the coronavirus and stop its spread.
The states that reopened early were indeed the hardest hit states economically. While these states normally account for 40% of our total volume, they now only account for about 14% of our total volume, which is still an improvement over 11% from last week, and 7% the week before that. Yet these states accounted for 23% of our total volume during the weeks that they were shutdown. However, this does not mean that reopening has hurt their local economies. In looking at their total volume, it has remained fairly consistent throughout the pandemic. However, the local economies that waited longer to reopen actually started picking up steam at the same time that Georgia became the first state to reopen. In other words, as we’ve started to see slight increases in volume over the last few weeks, pretty much all of it has been coming from states that waited longer to reopen.
As far as payables are concerned, it did seem like businesses in states that reopened early had an easier time paying their bills. Last week we reported that businesses in states that reopened early were 6% less likely to be past due than businesses in states that reopened later. However, this week, which saw more older invoices get paid than any week prior during the pandemic, this gap in payables has narrowed to just 3%. This could either be due to PPP funds becoming available, or simply because at this point almost every retailer in the country has been allowed to reopen to some extent, whether it is at limited capacity or for curb-side pickup orders.
While business does seem to be improving for the most part, our economy is still mirroring our lifestyles, far from normal. DSA Factors will continue to provide weekly reports on the economy and how the COVID-19 pandemic is affecting retailers and small businesses.
- America
- Small Business
May 20, 2020
Categories:
Three Weeks of Continued Growth, but the Economy is Still Suffering from the COVID-19 Pandamic
Once again we have good news to report for the economy as last week became the third straight week of improvement for several of the data points we’ve been tracking throughout the economic downturn. While we are still far from normal, the data we are seeing is the strongest since the first stay-at-home orders were issued. We may still have a long way to go towards a full recovery, but it does appear that the worst is behind us now.
Purchase Orders
For three straight weeks now, we have seen positive growth in the number of credit approval requests we have received. This translates to more companies placing purchase orders. The number of requests last week was up 11% from the week before and has risen to just above 50% or normal levels. Purchase orders hit a low of 25% of normal levels just a little over a month ago before the growth streak began. The total dollars being requested is also up significantly to 61% of normal levels after it dropped the week before to only 38%. While this would imply that large corporations are placing more orders than small businesses, the difference isn’t that great and it would be reasonable to assume that small businesses have improved over the last week along with major retailers.
Purchases
While purchase orders have been tracking upwards, actual purchases has been a little bit more chaotic with large fluctuations taking place in both directions for pretty much the entire pandemic. This past week purchases reached 58% of normal levels, as compared to just 36% the week before. One reason for the differences between purchase orders and purchases could be that large corporations tend to place large purchase orders months in advance, while small businesses place purchase orders that they expect to get filled within a few days. On average, purchases have been fluctuating by 32% in either direction on a weekly basis, which has made it difficult to interpret what this data really means.
Payables
Payables data has also improved for the third straight week and have reached a level that they have not been at since early April. Given that there is a 30 day delay in seeing this data get affected, this is very promising considering that early April was just a week or two into stay-at-home orders. The percentage of current receivables has grown by 8% this week to 44%, the low point of 31% occurred back on April 27th. Even more important is that the number of current receivables has actually grown for the first time since the pandemic began, and by 16%. In terms of dollars, we also saw positive growth, but it wasn’t quite as strong. The total dollars that are current grew by nearly 3% over the previous week, marking the second time we’ve seen this number grow during the pandemic. The percent of dollars that are current improved by 1% over last week to 64%. While both data points have improved, the fact that the number of invoices has improved more than their dollar value would imply that much of this improvement is coming from small businesses that tend to place smaller orders.
While a larger percent of current receivables is a very positive sign, what is even more encouraging is a much smaller percent of older receivables. Despite seeing the first growth in the number of current receivables, the total number of outstanding receivables still went down over the last week. This means that even more past due invoices are getting paid now. The number of invoices that are 1-30 days beyond terms dropped by over 26%, and the number of invoices that are even older dropped by 5%. The same is true of total dollars. The total dollars of invoices that are 1-30 days beyond terms decreased by 4%, while even older invoices decreased by 1%. Once again, this large differential between numbers and dollars would imply that small businesses are actually having an easier time paying their past due bills than large corporations. We believe that a major reason for this may be that the expansion of the Paycheck Protection Program (PPP) has allowed many small businesses that were shutout of the initial round of funding, to receive funding during the second round.
At this time the number of invoices that are 1-30 days beyond terms is now 25% of all outstanding invoices, and account for 17% of total outstanding dollars. Both of these numbers are actually normal, which really isn’t too surprising. The oldest invoices in this group would have been created 2 months ago as the first stay-at-home orders were being issued. Therefore, we can assume that most of these orders were placed during the pandemic from businesses that already been impacted and knew the challenges that they would be facing at the time the order was placed.
What isn’t normal is the percent of invoices that are now 31-60 days beyond terms. While their numbers have decreased, they still account for 21% of all outstanding invoices and 11% of total outstanding dollars. The good news is that both of these numbers have dropped for the first time since the pandemic began, last week the numbers were 23% and 12% respectively. Under normal conditions however, these numbers should be approximately 3% and 1%.
Unfortunately, a lot of the decline in invoices 31-60 days beyond terms is due to growth in invoices that are even slower. Luckily these numbers haven’t grown quite as fast as the 31-60 day numbers have declined. That means that while a handful of businesses are falling even further behind, there are still more businesses that are catching up. It is also important to note that these businesses that are falling further behind were already beyond terms at the start of the pandemic. Certainly for businesses that were already struggling, the pandemic would have amplified their struggles. The perfect example of this can be seen in companies like J.C. Penney and Neiman Marcus, both of which have been struggling for years, but finally filed for bankruptcy during the pandemic.
State-by-State
At this point pretty much every state has opened up to some degree, although the states that reopened first seemed to have opened up more than those that have waited longer to do so. As a result, we will be comparing states that reopened prior to May 9th to those that reopened afterwards.
As we’ve seen over the past few weeks, the states that were earlier to open were the states whose local economies were hardest hit by the pandemic. The reopening of these states also hadn’t made a major impact in the first weeks of reopening. Last weeks data is slightly improved over the previous weeks, but these states are still struggling more compared to the states that have waited longer to reopen their economies. Normally these states that opened early would account for 40% of our volume, but as of last week they only accounted for 7%. This week we can report that they now account for 11% of our volume, which while an improvement, is still way below their normal levels.
In terms of payables, businesses in all states seem to have made steady progress since last week. Once again businesses in states that reopened early were 6% less likely to be past due than businesses in states that reopened later. However, since new receivables aren’t growing in these states that reopened early, the vast majority, 75% of their receivables, are past due, while only 58% of receivables are past due in states that waited longer to reopen. As a result, it appears that businesses in states that reopened sooner have had an easier time paying off their debts from prior to the start of the pandemic, but they have been unable to place new orders. Part of this may be due to unemployment rates in each state. Georgia, the first state to reopen, has been the hardest hit state in terms of unemployment. It does seem that the other states who were early to reopen have also been hit harder than states that waited longer to do so. Surprisingly, while New York has been home to the largest outbreak, its faired much better than most states when it comes to unemployment.
It seems quite clear that the decision to reopen has been made based on how badly the economy is hurting, and not on the state’s ability to treat or contain the COVID-19 outbreak. Unfortunately, it seems like how quickly a state reopens has little effect on how quickly the economy in that state recovers. While it is true that we have seen much improvement over the last couple of weeks, that improvement seems to mostly be coming from states that have taken slower and softer steps in reopening their economies. How quickly a state is able to recover has more to do with how badly they were hurt than how quickly they reopened their economies.
DSA Factors will continue to report weekly on what our data is showing until our economy recovers fully. While we still have a long way to go, it does appear that the recovery is underway, it just won’t happen as fast as the collapse.
- America
- Small Business

May 13, 2020
Categories:
Small Businesses Continue to Recover from the COVID-19 Pandemic
We announced last week that we were starting to see the beginnings of a recovery for small businesses during the COVID-19 pandemic. In analyzing the data from last week it appears that this trend has continued. For the first time during the COVID-19 pandemic, we have actually seen the data points we are tracking improve for two consecutive weeks. However, we are still far from being back to normal. Lets dive into last week’s data.
Purchase Orders
We reported a huge jump last week in the number of approval requests we received when these requests jumped from an average of 29% up to 45% of normal levels. Last week, the number of approval requests we received was 1% higher, and while that may not be much, it is still a huge improvement over where they had been earlier in the pandemic and the first time we saw a positive change in consecutive weeks. However, while the number of approval requests remained relatively stable at 46% of normal levels, the total dollars of those approval requests dropped significantly over the week before. Two weeks ago we saw the total dollars at 54% of normal levels, but this week they were only at 38% of normal levels. This also marks the first time that the percentage for dollars dropped below the percentage for total number of approval requests during the pandemic. While this might seem concerning, it is actually good news for small businesses. In general small businesses place many small purchase orders, while large corporations would place a single large order. With the number of purchase orders remaining level, but their total dollar amount dropping, it would imply that the vast majority of the purchase orders were coming from small businesses, something that we have not seen since February.
Purchases
While we had good news to report for purchase orders, sadly the same was not true of purchases. Purchases dropped from 63% of normal levels two weeks ago, down to 36% of normal levels last week. This is actually the lowest level that purchases has been at since the start of the pandemic. Of course, it could easily be explained by small purchase orders from small businesses. In general there is very little delay between when a small business places an order and when that order ships. This is more of a sign that the major retailers have stopped placing large orders, perhaps because consumers have stopped hoarding essentials and purchasing habits are returning somewhat to normal.
Payables
Of course it is payables that reflects the true health of a business, are they able to pay for the merchandise they purchased. As has been true every week since outstanding receivables peaked on April 1st, the number of outstanding invoices have dropped once again. The number of outstanding invoices dropped by 9% last week, and total dollars dropped by 3.5%. Once again, this disparity between the number of invoices and their total dollars would imply that it has mainly bee small businesses that have been paying their bills last week.
More encouraging is looking at the aging buckets. For the second straight week we saw the percentage of receivables that are current rise ever so slightly. The percentage of receivables that are current rose by 3% to 37%. This is still a far cry from the normal level which would be at 66%, but a drastic improvement of the low we hit 3 weeks ago of 31%. Total dollars that are current also rose by 2% and now account for 63% of total dollars owed, normal levels would be 78%. While this does imply that much of what is current are large orders placed by major retailers, it generally takes about 30 days to see this data change, so the good news that purchase orders provided us about small businesses, probably won’t make an impact on these numbers for a few more weeks.
Past due invoices have also dropped significantly. With the number of past due invoices dropping over 13% and the total dollar of those invoices dropping by 9%. Invoices that are 1 to 30 days beyond terms now account for only 33% of total outstanding invoices, down from 44% last week and a peak of 52%. The dollar amount of those invoices now only accounts for 17.5% of total dollars, which is just a few percentage points away from being considered normal. Most of the invoices in this bucket would have been for orders placed after stay-at-home orders were issued and businesses forced to close, although a handful of them would have been placed just prior to the lockdown.
That leads us to invoices that are now 31 to 60 days beyond terms, all of which would be for orders that were placed before businesses were forced to close, and would have become due either as businesses were told to close or afterwards. The number of invoices in this bucket did increase 6% and total dollars increased by 4%. While these numbers are certainly concerning, they also make up a very small proportion of outstanding invoices, and hopefully they too will be getting paid as more of these businesses are allowed to reopen. Invoices that are older than this have pretty much remained level with several of the oldest getting paid.
State-by-State
Perhaps the most interesting data to see is how businesses are faring in states that are reopening. As we reported last week, the states that had reopened were the states that have been the hardest hit economically by the COVID-19 pandemic. We also reported last week that reopening efforts seemed not to have an impact on the businesses in these states, and if anything, actually made the situation worse. Once again this seems to be true looking at our most recent data.
Last week we reported that the states that have reopened accounted for approximately 8.5% of our total volume as compared to the usual 40% that they account for. This week that number has dropped down even more to 7%. While that may not be a drastic change, it is of course a change in the wrong direction, especially considering that reopening was supposed to improve the economy.
In terms of payables, the numbers are a little harder to read. Last week we figured out that businesses in states that reopened were 3% more likely to be past due than businesses in states that are yet to reopen. This week we found that businesses in states that reopened are 6% less likely to be past due. Past due invoices make up 14% of the total volume for 2020 in states that reopened, while they make up 20% of the total volume in states that are yet to reopen. While this is certainly a positive change, the problem is that current receivables in states that reopened aren’t growing. The result is that the vast majority of receivables in states that reopened are past due, while the vast majority of invoices in states that are yet to reopen are still current.
Unfortunately it seems like being open for business doesn’t equate to improved business, if anything, reopening might actually be hurting retailers. As always, DSA Factors will continue to monitor our data each week and provide updates on the economy and small business in America.
- America
- Retail
- Small Business
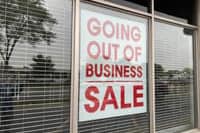
May 11, 2020
Categories:
COVID-19 Ushers in a New Chapter in the Retail Apocalypse
Last week marked a new chapter in the retail apocalypse when J. Crew became the first major retailer to file for bankruptcy during the COVID-19 crisis. While J. Crew was the first, Neiman Marcus quickly followed suit and many more are expected to follow. Retailers that had previously filed during the COVID-19 pandemic have included True Religion and Roots.
The retail apocalypse has been going on for quite few years now as traditional brick and mortar stores have been unable or unwilling to adapt to American consumers who are increasingly buying more and more products online. At the same time, ownership of these retailers has often times changed hands with the new owners taking on massive debt in order to purchase these retailers. Not only have they found themselves unable to pay off this debt due to declining revenues, but it has prevented them from being able to reinvest in their stores and online presence in order to retain existing customers and bring in new customers. Perhaps the most high-profile bankruptcy and subsequent closure to date has been that of Toys’R’Us who filed for bankruptcy in September 2017, and closed all of their stores in June 2018. They were quickly followed by Sears who filed for bankruptcy in October 2018, although they have managed to keep some of their stores open. But these are far from the only two retailers to seek bankruptcy protection.
Department stores, and other mall-based retailers have been hit particularly hard. Bon Ton, who operated a handful of department stores nationwide including Carson’s and Bergner’s, filed and subsequently went out of business in 2018. Many mall-based retailers such as The Limited have also closed up shop.
Prior to the COVID-19 pandemic, there was already a long list of retailers who either filed or were in danger of filing for bankruptcy. Just prior to the start of the pandemic in the US, Art Van Furniture filed for bankruptcy protection, but their going out of business sale was cut short when the pandemic forced them to close all of their stores. The same could happen to Forever 21, who filed for bankruptcy protection before the pandemic struck and has had liquidation sales canceled as a result of it.
Last Monday J. Crew, a mall-based retailer, became the first major retailer to file during the COVID-19 pandemic. They were followed by department store Neiman Marcus on Thursday. Meanwhile, department store Lord & Taylor is holding off on filing for bankruptcy but has announced they will be having liquidation sales start as soon as they are allowed to reopen their stores. There have been further reports that J.C. Penney and Stage Stores could both possibly be filing this week. J.C. Penney has already missed several interest payments, and if they fail to pay them by the end of the week they will be in default and could be forced into bankruptcy. Although other stores seem to think that they should be able to survive. Nordstrom secured $600 million in financing to keep the business operational during the pandemic, but still announced that 16 of their stores will be permanently closed as a result of the pandemic. Macy’s, who also owns Bloomingdale’s, announced that they had no plans to file for bankruptcy. However, Macy’s already had plans to close 125 stores prior to the pandemic, and is now seeking $5 billion in financing which they are yet to receive.
If the retail environment wasn’t scary enough prior to the pandemic, it just got a whole lot scarier. For wholesalers who sell to these companies it is more important than ever to make sure that your customers will be able to pay their bills. Unfortunately, credit insurance is no longer an option for most wholesalers. Credit insurance companies have stopped issuing new policies, and they have slashed credit limits on existing policies. Of course, the companies that have filed or are expected to file for bankruptcy protection were already severely distressed prior to the pandemic. It is unlikely that the credit insurance companies would have been issuing credit limits for them even before the pandemic hit. However, for retailers that had generous credit limits prior to the pandemic, those credit limits have all been slashed. So while receivables that date back before the start of the pandemic may be covered, it is highly unlikely that any new receivables will receive coverage. Furthermore, it has been reported that credit insurance companies who have been helpful in the past in explaining rules and regulations of their policies, are no longer being helpful and aren’t assisting their clients in filing claims.
With credit insurance no longer available, many wholesalers are now wondering how they can safely fulfill purchase orders at a time when retailers are struggling. For many wholesalers, the answer is non-recourse factoring. With non-recourse factoring not only are your receivables insured, but you also receive an advance on your receivables. That means you get funded for your receivables the same day you invoice your customers. This can prove more important than ever as even retailers who are expected to survive, and maybe even thrive afterwards, are extending their payment terms from net 30 to net 60 or even net 90. Now factoring companies are not in the business of losing money, so don’t expect them to approve an order for J.C. Penney, but for retailers who are expected to come out of this pandemic in reasonably good shape, they will still get approved. Furthermore, by partnering with a factoring company, you will ensure that your receivables will get paid as your factor won’t approve accounts that don’t have the ability to pay. DSA Factors is proud to offer non-recourse factoring to all of our wholesale clients, so if you are looking to insure your receivables please give us a call or send us an email, we will be happy to help.
- America
- Small Business

May 7, 2020
Categories:
The First Signs of Recovery for Small Businesses as the COVID-19 Pandemic Continues
While three weeks ago we reported a good week for large businesses based on several large orders our clients received, last week was the first time that we saw promising numbers for small businesses as well. As many states have begun to reopen, only time will tell if the affects will continue to be positive for both businesses as well as people’s health. Now lets take a closer look at last weeks data.
Purchase Orders
Last week we saw the highest number of approval requests since the COVID-19 pandemic began. While we were only at 45% of normal levels, that is a drastic increase over the 29% of normal levels that we have been averaging since lockdowns first got set in place. The total dollar value was at 54% of normal levels, a far cry from the 78% we saw three weeks ago, but a huge increase over the 33% we saw two weeks ago. While there is still a large disparity between number of approval requests and total dollars, it does still appear that small businesses are placing more purchase orders than they had been doing earlier in the pandemic.
Purchases
Just as we saw an uptick in credit approvals, we also saw a large uptick in purchases, meaning that orders actually got invoiced. Last week we are up to 63% of normal levels. While three weeks ago we saw a much higher percentage based on several very large orders, if we consider that week to be an outlier, purchases were up over 50% from all previous weeks of the pandemic, and almost double the 35% from two weeks ago. This is another positive sign that the economy is beginning to recover.
Payables
We have also seen more companies paying off their invoices, including invoices that were past due. The total number of outstanding invoices have dropped to 62% of their peak level on April 1st, and to 75% of total dollars from their April 1st high. These numbers both dropped by 10% from last weeks numbers. This of course is even more significant considering that at the same time we had one of our busiest weeks of purchases. The fact that more businesses are able to pay their bills is a very promising sign for the economy.
If we dive into this data even deeper, we also saw a 2% increase in the number of current receivables, this marks the first time since the pandemic began that the percent of current invoices has gone up. The total dollars of current receivables also increased by 1%, marking only the second time that we have seen a positive change since the pandemic began. While these numbers may seem small, the important thing to keep in mind is that they are indeed positive, especially considering that both numbers were falling by as much as 12% per week in early April.
While the number of current receivables and receivables 1-30 days past due has dropped by 16% and their dollar value has dropped by 12%, the number of invoices that are more than 30 days past due has also dropped by 5% although total dollars increased by 4%. This would imply that the companies that are struggling the most are the ones who placed larger orders. While certainly small businesses are faring worse than their larger counterparts, it appears that smaller businesses may actually be recovering faster, possibly due to Paycheck Protection Program (PPP) funds becoming available.
State-by-State
Of course, the big question to ask is if reopening has had a major impact on small business. Of the states that have reopened, prior to the pandemic they accounted for about 40% of our volume. During the pandemic however, they only accounted for 19% of our volume. Based on these numbers it is not surprising why these states have decided to reopen, their economies have been hit much harder than the economies of states who are taking greater safety precautions. While it may be a little bit too early to report on the effects of reopening, over the last two weeks these states only accounted for 8.5% of our total volume. It will be interesting to see if these numbers improve, but the numbers for Georgia, who nearly two weeks ago became the first state to reopen, are not promising. Since reopening on April 24th, we saw their volume drop to 40% of what it had been at during their lockdown which was effective from April 3rd.
From a payables point of view, things don’t look much better. The states that have reopened seem to be having a slightly harder time paying their expenses. Our data suggests that businesses in these states are 3% more likely to be past due than businesses in states that haven’t reopened. However, it takes time for checks to be delivered in the mail, so the next week or two may tell us more about if reopening actually leads to more available cash. These businesses may need to rehire employees, and if sales don’t pick up right away they could actually wind up in worse shape than they are already in.
As we reported earlier, the states that were quick to react have actually fared better economically than states that were slow to react. A lot of this may be due to the fact that major corporations such as Amazon, Target, and Costco are located in these states. These are also the states that have not reopened yet, so it is possible that these major retailers who have been thriving during the pandemic may also be the reason that states that are reopening still aren’t recovering. Keep following the Factoring 101 Blog each week as we report on the data we are seeing from the small business community.
- America
- Small Business

April 29, 2020
Categories:
The Economy Continues to Slow Down Even as Some States Start to Reopen
Last week we reported on a large uptick in business from major retailers, however, when analyzing data week by week it doesn’t really allow you to account for outliers. It is clear that the positive news we reported last week was indeed an outlier and not a sign that the economy was starting to recover. Unfortunately, our data from last week was the most dismal yet. Keep in mind, that while many states discussed reopening last week, it wasn’t until Friday that Georgia became the first state in the nation to begin the process. It will be interesting to see whether or not these reopenings make any impact in the coming weeks.
Purchase Orders and Purchases
The number of purchase orders we received credit approval requests for last week was at 28% of normal levels, which is pretty consistent with the data from the last few weeks. It is the second lowest percentage we’ve seen since the start of the COVID-19 pandemic, only the data we reported on two weeks ago was lower at 25% of normal. The bigger problem however is that total amount of dollars being requested for credit approval has dropped to 33% of normal, the previous low was 39%. Given how good last week was, it is not entirely surprising that this week is so low, after all, it was unlikely that we would be seeing large purchase orders two weeks in a row.
Along with the record low dollar amounts for purchase orders, the same was true for invoices purchased last week. The number of invoices purchased last week were down to 34% of normal levels, where the previous low had been 40%. Again, this came on the heels of a very good week the previous week. Certainly the economy is in the dumps, but neither purchase orders or invoices really indicate that things are getting worse, but rather just that they aren’t getting any better.
Payables
While it was no doubt a bad week for purchase orders and invoices purchased, it was actually a much worse week for payables. For the first time since April 1st, when we started analyzing the effects of the COVID-19 pandemic, our dollar amount of open receivables has actually gone up, a 2.2% increase over last week. They had been declining by an average of 5.5% per week prior to now. Even more concerning is that this happened during a week when we experienced our lowest level of purchased invoices yet. Today approximately 32% of receivables are still current, accounting for just less than 60% of dollars. While that total number of current receivables is the lowest yet, the dollar amount seems to be remaining fairly consistent. This would imply that it is larger orders from major retailers that have made up the bulk of recent business, and that we are doing very little with small businesses.
We have also reached the point where many businesses have now been closed for over a month, so it isn’t a surprise that there are very few current open receivables. The percent that are now 1-30 days beyond terms have remained level from last week, although the number of them has declined by 13%. However, there was a major uptick in open receivables that are now 31-60 days beyond terms. The number of receivables in this aging bucket has jumped by nearly 50%, while the dollar value of these receivables has jumped by 35%. This shows us that invoices for small businesses that became due just prior to or shortly after lockdowns got implemented that hadn’t gotten paid when they became due, are still not getting paid now.
Clearly this is further proof that the funds set aside for small businesses as part of the CARES act are either insufficient or unavailable to many small businesses. It will be interesting to see what happens in the next few weeks with invoices that are becoming 31-60 days beyond terms. If the number continues to grow, it will be due to invoices that were created prior to the lockdowns, but didn’t become due until after small businesses were forced to shut their doors. Keep following the Factoring 101 Blog for future updates on how COVID-19 is affecting small business in America.
- America
- Small Business

April 24, 2020
Categories:
Local Stay-at-Home Orders Don’t Directly Affect Local Economies
Today Georgia is starting to open up again and their residents can once again go bowling. Georgia was one of the last states to enact stay-at-home orders on April 3rd, and after 3 weeks those orders will be coming to an end. Regardless of the health implications involved in this decision making process, does doing this even make sense from an economic perspective? In analyzing our data, DSA Factors has determined that the enactment of local stay-at-home orders has very little effect on local economies. Rather it is what the nation is doing as whole that has a direct impact on local economies.
The third week of March was the first time that statewide stay-at-home orders were issued, with orders being issued only in California, Illinois, and New Jersey. While some counties and municipalities may have enacted similar orders earlier, most notably the Bay area, these were the first 3 states to take wide sweeping actions to combat the coronavirus. The following week 23 more states would follow suit, including hard hit states such as New York, Louisiana, and Michigan. The first week of April we saw 14 more states and Washington DC enact orders. It wasn’t until the second week of April that Missouri and South Carolina became the last two states to enact stay-at-home orders. However, there are still 8 states that have resisted enacting orders, Arkansas, Iowa, Nebraska, North Dakota, Oklahoma, South Dakota, Utah, and Wyoming.
While it is clear that the states all reacted at different times to the coronavirus pandemic, the economy did not. While the stock market started crashing earlier, during the third week of March it was still business as usual for most small businesses around the country. In fact, our data shows that sales were actually slightly above average in California, Illinois, and New Jersey, the three states that enacted stay-at-home orders that week.
By the fourth week of march when over half the states had enacted stay-at-home orders, small business sales saw a huge decline, being cut in half in states that had enacted orders. More interesting however is what happened in states that were still open for business. In the states that were still open, sales had dropped down to one third of normal levels.
The first week of April saw even stranger things happen, sales actually improved slightly in the states that had previously enacted stay-at-home orders, but in the states that enacted orders that week or were still open for business, sales fell to 20% of their normal levels.
Over the next two weeks these very same trends continued. The states that locked down first continued to see improved sales, even getting within 75% of what would be considered normal. But the states that were late to enact orders or held out on enacting orders saw sales plummet to below 10% of normal levels.
Now our data isn’t perfect, it is based on invoices purchased by state according to the invoice date. DSA primarily works with wholesalers and retailers, although we also do quite a bit with the hospitality industry. Certainly states that acted early are seeing higher volumes since companies such as Amazon, Target, and Costco are based out of these states. However, Walmart is based out of Arkansas which is one of the states that has held out on enacting stay-at-home orders, and Florida and Texas are both major economies that waited a long time before enacting orders. While we do have quite a few clients who sell food products, they mostly sell snack foods and candy, they do not sell the produce, meat, or dairy products that have been flying off of shelves. Interestingly, we have actually seen normal sales volume to Amazon and Target, but declining sales volume to Walmart. However, despite these issues, there is no doubt that the economy collapsed in many states long before they enacted stay-at-home orders. It is also important to note that the economies of California, Illinois, and New Jersey are doing much better than most other states, and none of these states are home to the corporations that have been thriving during the pandemic.
Regardless of how dangerous it may be for Georgia and other states to reopen from an epidemiological perspective, it is clear that the reason behind them doing this is to help revive a dead economy. Unfortunately, based on our data it appears that their plan isn’t going to work. It is doubtful that many people would be willing to get haircuts, eat at restaurants, or go bowling, and even more doubtful that they would be willing to sit in a movie theater for two hours with strangers sitting next to them. Plus schools have already been closed for the remainder of the school year in Georgia and the other states considering a reopening, making it nearly impossible for parents to return to work. The economy had already collapsed long before stay-at-home orders got enacted in these states, and now that millions of people have lost their jobs and many more have taken pay cuts, it is highly unlikely that they are going to want to go out and spend money at the expense of their own health and the health of their family, not to mention that it is unlikely that many employees will want to return to work at the risk of getting sick.
Sadly, it looks like the states that are hoping to revive their economies aren’t just ignoring public health. Our data paints a very clear picture that the existence of a local stay-at-home order has no direct correlation with the local economy. If anything, it proves that the states that acted early and most aggressively to contain the coronavirus, are the states that have maintained the strongest economies throughout the pandemic.
- America
- Furniture
- Small Business

April 23, 2020
Categories:
COVID-19’s Effect on the Furniture Industry
The COVID-19 pandemic has had an incredible effect on the furniture industry. While some retailers that sell furniture have been deemed essential businesses and have been allowed to continue operations through stay-at-home orders, most have either been forced to close or voluntarily closed. The same is true of furniture wholesalers, although for many wholesalers they have the luxury of being able to do most of their work from home, something that is not possible for their customers in retail. While DSA Factors has been providing updates on the small business community throughout the COVID-19 pandemic, one of our largest areas of specialization is in furniture, so it made sense to report on the status of the furniture industry at this time. Therefore, we have decided to use our data to give a report on the state of the furniture industry at this time.
For the start of the year it was pretty much business as usual for the furniture industry. Even though the COVID-19 virus was spreading across China at the start of the year, it didn’t seem to have any impact on the furniture industry in America. Part of the reason may be that the Chinese New Year holiday took place as the virus first started spreading, and factories are normally shut down for several weeks during the holiday period. In fact, it was business as usual for the first 3 weeks of March as well. While the NBA suspended their season on March 11th, and the other sports quickly followed suit, the guidance at that time was simply to avoid large gatherings. It wasn’t until March 19th that California issued the nation’s first statewide stay-at-home order, which was quickly followed by Illinois on the 21st and New York on the 22nd.
The fourth week of March, after millions of Americans were ordered to stay at home, we saw a drastic decline in the furniture industry with over one third of furniture wholesalers closing up shop that week. At the same time, sales, which had remained steady up until that point, were down by 70% that week. As April began, more and more furniture wholesalers started closing their businesses, although sales have remained steady at 70% below normal levels throughout April. As of today, a little less than a third of furniture wholesalers are still doing business.
However, there is one sector of the furniture industry that hasn’t been hit as hard during this pandemic, that is the casual furniture sector. As the weather start warming up and people are forced to stay at home, the casual furniture sector is expecting to see some large sales numbers as people start to invest in their own backyard more and more. While many casual furniture retailers remain closed, they are still placing orders as they are very optimistic that many Americans are going to want to make their own outdoor spaces more comfortable.
While it would be a lie to say that the casual furniture sector has not been hurt by the COVID-19 pandemic, it is doing much better than the furniture industry as a whole. Just like the entire furniture industry, the third week of March was the last week of business for a third of casual furniture wholesalers. However, half of casual furniture wholesalers remain open and are still doing business today. While the last week of March saw sales drop by 75% for casual furniture wholesalers, those sales numbers have been improving throughout April and are now at normal levels.
For retailers, those who are in casual furniture seem to doing better as well. Furniture retailers in general started having trouble paying for merchandise that was invoiced during the final week of February. This makes sense as these invoices would have become due in the final week of March as stay-at-home orders were being put into place and many retailers were forced to close their doors. For merchandise that was invoices in March, 60% of it has not been paid yet. However, retailers in the casual furniture sector have been doing better. Casual furniture retailers are about a week ahead on their payments with most invoices from February having been paid, and only 50% of merchandise invoiced in March remaining unpaid. Only time will tell if these trends hold up, but for now it seems like the casual furniture sector is doing alright.
DSA Factors continues to monitor the COVID-19 pandemic’s impact on the economy. Check back regularly for more updates in the future. Stay safe and stay healthy.
- America
- Small Business

April 21, 2020
Categories:
Large Businesses are Recovering as Small Businesses Continue to Hurt During the COVID-19 Pandemic
DSA Factors has been providing weekly reports of the state of small business in America during the COVID-19 pandemic based on our data. The trend over the past few weeks has been bad, and unfortunately this week doesn’t look any better for the small business community. Despite the continuation of stay-at-home orders and the cancelation of school for the remainder of the school year in many areas, the good news is that we are starting to see larger businesses recover, so hopefully the same may be true of small businesses in the not too distant future.
We have three different types of data points that we can look it, each which has its own advantages. First is we can look at credit approval requests which is directly tied to purchase orders. This data shows the impact of state-wide lockdowns in real time as businesses aren’t placing orders if they are no longer open for business. However, a purchase order is for a future transaction, so a decline in purchase orders equates to a decline in business in the coming weeks, but not necessarily right now.
The second data point is purchases, or in other words, how many receivables we have bought. This data is very similar to purchase orders in many ways but is generally about a week behind. More importantly however, it reflects an actual sale, meaning that the product shipped and the customer was willing to receive it. Where a purchase order may be canceled, an actual purchase is a finished transaction so the data is of higher quality.
Finally, we are looking at aging buckets for payables. This is perhaps the best measurement tool we have as it shows whether or not businesses are able to pay for the products we received. However, since customers are usually offered net 30 day terms, it means that this data is 30 days behind the other data. There have also been a large number of businesses, especially large businesses, who are now requesting extended terms from their vendors. In this situation the data gets slowed down even further. So while this might be the most relevant information, it takes much longer to see changes in it.
Purchase Orders
While purchase orders are still down, there are some reasons to be optimistic this week about the state of the economy. The number of credit approval requests this week were at 30% of what is considered to be average, which is a 20% increase over the previous week and comparable to the levels we saw at the end of March when there were still some very large parts of the country that had not shut down businesses yet. Even more interesting is that the volume of these purchase orders is at 78% of what is considered average, double where it has been for the previous two weeks. While this is certainly positive, it can be attributed mainly to the fact that we received several large purchase orders from some major retailers, many of whom do not operate in brick-and-mortar. So while major retailers may be feeling more confident, sadly it looks like purchase orders have pretty much dried up from America’s small business community. We can only hope that the confidence that major retailers have will rub off on small businesses as well.
Purchases
Just like purchase orders, the amount of purchases this week was also up significantly to 95% of normal levels. The previous two weeks purchases were at approximately 40% of normal levels. While this may appear to be wonderful news, we can again attribute well over half of this to large orders from major retailers as well as a need for purchase order financing to fund some of the orders mentioned above. Sadly, it looks like very few small businesses are making any purchases.
Payables
As we mentioned this is the most relevant data but it also takes time to see how the data is affected. While two weeks ago we saw a slight slowdown in payables, last week was the first time that we saw a major change, and this week continues the decline. There is no doubt that many businesses are taking longer to pay or are unable to pay. But it is also important to note that many of them are still able to pay. With better data available this week than in the previous two weeks we will dive a little bit deeper into this data.
There is both good and bad news to report this week. The good news is that it appears that major retailers are starting to pay their receivables. The percentage of receivables that are current (calculated by total dollars) has actually increased 2% this week, these receivables now account for 60% of total dollars. While normal would be around 78%, it is still promising to see a 2% improvement. Now a lot of this can be attributed to the large number of purchases we made this week (all of which would of course be current), but the total amount of outstanding receivables that are current has pretty much remained the same, we saw only a 0.1% decline in total dollars.
While current open receivables have remained steady, the total dollar amount of all open receivables has has actually dropped by 3.5% over last weeks amount. There was a 5% decline in total dollars in the 1-30 days late bucket, a 25% decline in total dollars in the 31-60 days bucket. While severely past due invoices remained about the same. Overall, the total dollars past due has declined by 8% which is a very promising sign that businesses are able to pay for their merchandise. That said, it should still be noted that while the total dollar amount of all outstanding receivables is down about 9% from where they would normally be, the total dollar amount of past due receivables is up about 40% from where it would normally be.
Of course, all of the above data combines both large and small businesses. Since large businesses place larger orders, looking at total dollar amounts is a good indication of how major retailers are doing. A better indicator for small businesses would be the total number of receivables. Unfortunately, these numbers have gotten much worse over the previous week.
Only 34% of all invoices are still current, down from last weeks number of 43% and 50% from the week before. During normal times the number of receivables that are current would be approximately 66%. The number of receivables that are 1-30 days past due now accounts for 50% of all outstanding receivables, up from 47% last week and 42% the week before. The number of receivables that are 31-60 days late also jumped and is now at 10%, compared to just 6% last week, and are normally 4%. Severely past due invoices have pretty much remained unchanged.
While those percentages may seem like payments are slowing down, and they certainly are, it doesn’t paint the whole picture. It is important to also take into consideration that number of open receivables we have has dropped considerably, by approximately 13% in both of the last two weeks. Most of this decline can be accounted for in current receivables which are 60% lower than what would be considered normal. The number of receivables that are 1-30 days beyond terms actually peeked on April 6th at pretty much double what is considered to be normal, but have gone down by 3% in each of the past two weeks. More problematic is that we saw a large increase in the number of receivables that are 31-60 days beyond terms which are up 37% over last week and are double what would be considered normal.
When you consider these numbers, the vast discrepancy between number of invoices and dollar amounts suggests that the vast majority of our business is coming from major retailers, and that these retailers are not having too much trouble paying their bills. Unfortunately, a large decline in dollars and a sharp increase in number of receivables beyond terms would imply that many small businesses are struggling to stay alive during the COVID-19 pandemic.
The good news however, despite what the data suggests, so far this week it seems like most communications we have received from small businesses are that payments are being sent. While some accounts are still saying that they are unable to pay or are awaiting SBA funding, the number of accounts saying this has gone done significantly. It is possible that some of this may be the result of small businesses who have received funding through the Paycheck Protection Program (PPP). Funding for the program ran out on Thursday, but it looks like congress has a reached an agreement to add more funds to the program. Regardless of what happens in congress, it will be interesting to see how the data looks next week, will the positive trends from this last week continue? Keep checking the DSA blog each week to learn more about the current state of small business in America.
- America
- Small Business
April 15, 2020
Categories:
Small Business Accounts Payables Are Slowing Down Dramatically
Here at DSA Factors we have been discussing the effects of the COVID-19 pandemic on small business through analyzing our data. The first sign of the slowdown occurred three weeks ago when we noticed a sharp decline in purchase orders. Two weeks ago the data showed that purchases had also slowed down dramatically. Payments on the other hand are the one thing that had a very minor decline over the first few weeks of the pandemic, but that can mostly be attributed to the fact that companies have 30 days to pay for an invoice. Last week marked approximately one month since schools and businesses started closing and stay-at-home orders became enacted, so last week’s payments data is the first to show a significant slowdown in payables.
Purchase Orders
While this last week wasn’t drastically different from the previous two weeks, it does appear that the number of purchase orders from small businesses is continuing to decline. The number of purchase orders last week dropped down to 25% of normal, down from 29% and 32% over the previous two weeks. Interestingly, the total dollar amount actually increased slightly this last week to 42% of normal, the previous week it had been at 39%, and it was at 49% the week before that. The fact that the number of purchase orders have declined, but their value has increased means that the purchase orders coming in are for larger dollar amounts, and therefore most likely from major retailers. Given that March is typically our busiest month, three weeks ago we estimated that orders for small businesses were down by 88% over the same time last year. Last week’s data is looking even worse and we now estimate that orders from small businesses are down by 90%.
Purchases
Purchases of invoices tends to lag a little bit behind purchase orders as it takes time to put together an order, as a result, the decline that we saw in purchases hadn’t been as sharp as the decline that we saw in purchase orders over the previous few weeks. However, last weeks data suggests that purchases are catching up to purchase orders. Last weeks purchase data dropped just below of 40% of normal. While this isn’t a huge change from two weeks ago when purchases were at 43% of normal levels, it is a huge change from three weeks ago when purchases were at 73% of normal.
Payables
Up until last week we saw payables slowing down slightly, but still within reason. Normally, approximately 66% of our receivables are current, accounting for approximately 78% of money owed to us. Of receivables that go beyond terms, the vast majority are within 30 days of the due date with only 5% severely delinquent both in terms of numbers and dollar amounts. This implies of course that large corporations typically pay a little bit faster than small businesses, but that most small businesses pay their receivables in a timely fashion. Normally we only track this data on a monthly basis, so prior to April 1st, we previously recorded this data on March 1st. Since April 1st we started tracking this data weekly.
The data from three weeks ago suggested that there had been a very slight slowdown in companies’ abilities to pay with past due invoices rising by approximately 4% both in terms of number of invoices and dollars. While this drop is noticeable, statistically it probably isn’t too relevant. Two weeks ago the slowdown became more pronounced. The number of current receivables hovered just above 50% which accounted for 70% of money owed. The much sharper decline in number of receivables compared to money owed would imply that it is mainly small businesses who were finding it difficult to pay.
Last weeks data paints a drastically different picture. The number of receivables still current have dropped down to 43%, accounting for 58% of money owed. While the amount of severely delinquent receivables, which hadn’t increased by too much over the previous two weeks, have increased to approximately 10%. These numbers of course are very disturbing and painting a very sad picture of the state of small businesses in America. While many small businesses are still making payments, and our overall receivables have lowered by 15% since the start of the month, it is very clear that many small businesses are simply unable to pay for the merchandise they purchased.
These numbers aren’t surprising given the number of communications we have received from businesses who have been forced to shut down for over a month now, and others who remain open but don’t have any sales or even any customers. Many are waiting to receive SBA loans that were part of the $2.3 trillion CARES package, which includes the Paycheck Protection Program (PPP) that went live about a week and a half ago. Once these funds begin to come in, many of the small businesses who have contacted us say that they should be able to pay what they owe. However, it is unclear how many small businesses have actually received funds yet, funding is taking much longer than the three days promised in the CARES act. There is also a fear that the money set aside for the PPP program is about to run out, there already is nowhere near enough funding for the Economic Injury Disaster Loan (EIDL) program run by the SBA.
While the $1200 payments to individual who qualify have started getting deposited in people’s bank accounts this week, it appears that most individuals will be using the funds to either purchase essentials such as food, pay credit card bills, rent, or their mortgage, while others will be putting the money into savings in case they need it later during the pandemic. While the 2008 stimulus money was partially spent in ways that helped the economy, it is unlikely that will be the case this time around. As a result, it is doubtful small businesses will realize any benefit from these deposits into people’s bank accounts.
Please check back each week as DSA Factors continues to analyze the data to bring you up to date with the status of small business in America.
- America
- Fintech
- Small Business

April 9, 2020
Categories:
Fintech’s Massive Failure During the COVID-19 Pandemic
Fintech has been a major disruptor in the financial world over the last few years. Their promise of quick access to funds available at your fingertips has changed the landscape of commercial lending. Perhaps the most attractive part of it is that everything is done seamlessly online. So it would be reasonable to assume that as millions of Americans are under stay-at-home orders, Fintech should be the go to source for funds to keep struggling small businesses from collapsing. However, it is turned out that the major Fintech companies are doing the exact opposite. Instead of providing the access to capital that small businesses are desperate for, they instead are shutting down their operations altogether.
A prime example of what is happening in the Fintech world is perhaps one of the largest and most well known lenders in the Fintech arena, Kabbage. Not only is Kabbage not providing Paycheck Protection Program (PPP) loans under the CARES act, they have completely stopped giving out loans altogether. The only thing that they are offering small businesses these days is a platform to sell gift cards on which they claim they will not profit from. But small business owners aren’t alone, Kabbage is also furloughing most of their employees and completely shutting down their office in Bangalore, India. A company that has received billions of dollars from investors, not only is turning its back on its clients, but also on its own employees.
Even more surprising is the fact that on March 10th, Kabbage’s CEO and founder Rob Frohwein suggested a three week lockdown for the country. While certainly he was correct about a lockdown being needed to stop the spread of the virus and flatten the curve, he also believed that it would be a good thing for small business. He wrote “my hope is that a plan like this one saves millions of lives and saves millions of businesses – many of them small businesses that cannot afford three months, a year or even potentially longer exposure to this threat. Small businesses are most at risk during long periods of disruption. We need to avoid this as small businesses account for more than half of the non-farm GDP in the United States and two-thirds of all new jobs.” While he did argue for only three weeks, and not months, given that China has been locked down for over three months, it is pretty unrealistic to expect things would go back to normal after only three weeks. However, here we are three weeks in, and for some parts of the country even less, small businesses are struggling to stay alive and Frohwein’s company has already stopped giving loans. When states actually decided to follow his suggestion that he claimed would be good for small businesses, he decided to stop supporting small businesses. Clearly large Fintech companies like Kabbage do not understand, or perhaps don’t even care, about the needs or success of small businesses.
Other lenders in this space are also shutting down operations. Two of the more popular Fintech companies to put new loans on hold and to stop allowing existing clients to draw on their line of credit are Fundbox and OnDeck. However, they certainly aren’t alone, and the few companies out there still giving loans are restricting funding only to certain industries such as the grocery and medical industries. For companies in hospitality and other industries that have been shut down, there simply aren’t any options available. At a time when small business owners need funding the most, Fintech is not providing their customers with access to the funds they desperately need.
To make matters worse, for small businesses that already have a loan or line of credit with a Fintech company, they will be unable to look elsewhere for funding as the Fintech companies are holding their assets as collateral. Unfortunately for small business owners, there is nothing they can do about this since the law protects the Fintech companies in a situation like this. To further add insult to injury, these Fintech companies, including Kabbage, will continue to make daily or weekly withdrawals from the bank accounts of small businesses that no longer have any revenues. This of course is the price to pay when we allow algorithms to make major financial decisions in place of humans.
Another type of Fintech is supply chain financing, where C2FO is a leader in the space. C2FO effectively works as an intermediary between vendors and their customers. If a customer is willing to pay an invoice early, they will submit it to their vendors via C2FO and the vendors will have the ability to offer them a discount in order to get paid that same day, rather than wait until the invoice becomes due. It is then up to the customer to either accept or decline that offer, and if they decline the offer the vendor can offer a larger discount the following business day. In theory it’s a win-win situation for both vendors and their customers. Vendors get paid earlier and oftentimes the cost is a little bit less than if they factored the invoice, while cash rich customers get a discount on their merchandise. C2FO doesn’t make commissions facilitating these discussions, and the funds do not pass through their accounts, they make their money through a monthly service fee from retailers who choose to use their platform.
However, where supply chain finance fails is in a situation like the current coronavirus pandemic. Many cash rich customers no longer have positive cash flow. With their stores having been closed for several weeks, many of these companies have furloughed or laid off employees, they’ve stopped paying rent, and they are extending the terms of their invoices (regardless of whether or not their vendors approve). In the clothing industry, due to the fact that merchandise is purchased a season in advance and it isn’t going to be able to sell this year, many retailers are requesting very large discounts along with extended terms from their vendors. In other words, major retailers aren’t submitting invoices to C2FO for early payment, or if they are, they are requiring extremely large discounts. As a result, companies that have been relying on supply chain finance for the last few years are finding that immediate funding is either no longer available or is too expensive.
Furthermore, for vendors who saw supply chain finance as a way to avoid needing credit insurance, now they are stuck with receivables for customers who may be struggling financially, and depending on how long they are forced to remain closed, may even need to file for bankruptcy. We already saw this sort of activity happen in the months leading up to Toys’R’Us’s demise in 2017. Toys’R’Us had partnered with C2FO to provide vendors early payment, and customers who wanted to receive early payments in the months leading up to the initial bankruptcy were being forced to give discounts of 25-50%. To make matters worse, after Toys’R’Us filed bankruptcy, these payments would have been considered preferential payments and the bankruptcy court would have demanded they get returned. As major retailers are forced to stay closed longer, there is a very real threat that we may see a lot more of this.
Shockingly, C2FO is trying to advocate for small businesses by arguing that major corporations should get government bailouts. According to their data, small businesses around the world have $16 trillion in open receivables, and if they received payment for these receivables today, it would help them survive this current crisis. While these funds would help small businesses, who don’t already get an advance on their receivables, to survive the next 30 days, it will do nothing for these small businesses a month from now when they are still not getting in any new orders. Without any orders, they will have no receivables, and this type of funding will no longer be available Furthermore, their theory is that the large corporations could use these bailouts to pay their suppliers, the reality is that this has never been the result of government bailouts in the past. The bailouts in 2008 and 2009 worked wonders for the banks, but did nothing for the people who lost their homes due to foreclosures.
Even if these major corporations used these funds properly and paid off receivables owed to small businesses, it wouldn’t help small businesses who sell to other small businesses. At DSA Factors our clients sell to both major retailers as well as small businesses. Our clients, all of whom are small businesses, do approximately 55% of their volume with other small businesses. Another 28% of their volume comes from major retailers like Amazon, Target, Walmart, and other essential businesses such as grocery store chains that are thriving right now and are in no need of receiving a bailout. That leaves just 17% of total receivables owed to small businesses that could actually get paid with such a bailout. Of that 17%, many of these businesses are cash rich (TJX) or have a strong online presence (Wayfair) and will not require a bailout to weather this current economic downturn. Sadly, C2FO is just another example of how a massive Fintech corporation does not understand the actual needs of small businesses.
For many small businesses who loved the appeal of fast and easy funding that Fintech offered them, that funding has completely disappeared at a time when they need it most. There is little doubt that Fintech companies will be back in business at the end of the COVID-19 pandemic, after all, they will be sitting on the billions of dollars that they’ve stopped lending. However, are the small companies who made them rich going to continue to seek out their services? Will small businesses feel betrayed that the Fintech companies who were so quick to offer support, quickly turned their backs when times got tough? Will small businesses ultimately be bankrupted because the Fintech companies won’t stop pulling funds directly out of their bank accounts? This is the first economic downturn in the Fintech age, but it certainly won’t be the last. At least for now, it looks like Fintech isn’t up to the challenge.
- America
- Small Business

April 7, 2020
Categories:
Small Business Continues to Decline as a Result of COVID-19 Pandemic
As the nation and hospitals brace for what is expected to the peak of the coronavirus pandemic in the coming weeks, small businesses are getting hit harder and harder. The CARES act and the Paycheck Protection Program (PPP) while helpful, come nowhere close to meeting the needs of small businesses, many of which have already been closed for several weeks. While the data from two weeks ago looked dismal, last weeks data is looking even worse. Last week we examined purchase orders which have declined even more this week. We will also expand our analysis to include sales for wholesalers, and small business cash flow.
Over the past week we saw a drop of 10% over the previous week in credit approval requests for new purchase orders. While 10% may not sound that bad, seeing how the previous week had only a quarter of the requests that we would normally expect this time of year, it simply shows that what is already incredibly slow business is getting even slower. Another data point to look at is how much money these credit approval requests have been for. Last week we saw another 20% decline over the previous week. In other words, there are not only fewer purchase orders, but the individual purchase orders are for significantly less money as well.
The next data point is sales, which is based on how much volume our clients are factoring with us. This data doesn’t react quite as quickly to business conditions as it may take several days to fulfill a small purchase order, or several months to fulfill a large purchase order. However, for small retailers, generally they place an order, and if the merchandise is in stock it ships out very quickly and we usually purchase the invoice within a week. This data is a bit tricky to analyze as one or two large orders can greatly skew how much we factor in any given week. As a result, our weekly sales volume can vary by quite bit each week depending on when major orders ship. In general, any given week usually fluctuates within 80-120% of the average week.
Looking at our data, we don’t really see anything unusual happening in sales until the week beginning March 22nd. In fact the weeks beginning March 8th and March 15th were both very busy weeks. The week beginning March 22nd we saw sales to 74% of average, and while it was at the time our slowest week of the year, it was only off by a few percentage points from some of our slower weeks. We really see the impact of the coronavirus pandemic in last week’s data (the week beginning March 29th) where sales dropped to 43% of average. To give some perspective to how slow last week was, in the last year, only the weeks of Christmas and Thanksgiving had lower sales. In general March is normally one of our busiest months and we typically have 5-25% more sales in March than we do throughout the rest of the year.
The other data to look at is how long it is taking businesses to pay their invoices as this is a good measure of their cash flow. While the credit approval requests and sales give us a real time snapshot of the current business environment, payment data is slightly delayed. In general, businesses are given 30 days to pay their invoices, meaning that invoice from mid-March when many businesses were forced to shut down won’t be due for another week still. However, invoices from the second half February and the beginning of March would have become due while businesses were shut down, and we are starting to see the impact of the shutdown on business’s ability to pay.
Under normal conditions we could expect approximately two thirds of outstanding invoices to still be current while a quarter of invoices are less than thirty days beyond terms, and only 6-7% of invoices are severely past due. In terms of dollar amounts, normally more than three quarters of invoices are current, 15% are less than thirty days beyond terms, and around 5% are severely past due.
Comparing April 1st to March 1st (normally this data is collected on a monthly basis) we saw payments slowing down slightly, but the numbers certainly weren’t cause for alarm. The number of past due invoices only grew by about 5%, while the dollar value of past due invoices only increased by maybe 2.5%. While these numbers do appear to be outside the normal fluctuations we see from month to month, neither of them is all that alarming.
However, when we compare April 6th to April 1st we start to see some very scary trends. Only half of all invoices are still current, while the number of past due invoices is 15% more than normal. From a dollar perspective, the amount of past due invoices is about 7.5% more than what it should be. Given that the number of past due invoices is growing twice as fast as the dollar amount, that would imply that it is small businesses that are falling behind, and that major retailers are for the most part still able to pay their bills on time.
Keep in mind that the data from these reports, while encompassing virtually all industries, is mostly based on retail sector which makes up the majority of our business. DSA Factors will continue to monitor these trends and provide weekly updates on the state of small business in America.
- America
- Small Business

March 26, 2020
Categories:
Small Businesses Down 88% as a Result of the Coronavirus Pandemic
Everyone is well aware of the stock market’s crash over the last month. We are well aware of how airlines have been canceling flights, hotels are shutting down, cruise ships have stopped sailing, and even Disney has had to close all of its parks. However, very little discussion has been had about how the COVID-19 pandemic is affecting small businesses. Yes, we are well aware that many states have told restaurants to close their doors and only do carry out and delivery orders. When you walk down the street you’ve probably noticed that the lights are off in salons and barber shops. You’ve probably even seen posts on social media encouraging you to go out and support your local business community in whatever way you can. However, very little has been said about the actual effects on small business from a statistical point of view.
According to the SBA (Small Business Administration), the over 30 million small businesses in the US employee roughly 60 million people, approximately half of the entire workforce. Those are some pretty big numbers that are very difficult to ignore. At the same time, because there are so many small businesses across the US, it is very difficult to collect data on them, especially pertaining to how the COVID-19 pandemic is affecting them. While we don’t have all the answers here at DSA, we have been able to analyze our data a bit to tell you what we have been seeing. Keep in mind, that with everything having changed so quickly, we don’t have a lot of data to work with. While DSA Factors works with a wide range of industries, it is the wholesale and retail sectors that we are most heavily invested in.
While there are many ways for us to measure the impact of the COVID-19 pandemic on small business, much of this data is too new to see any actual changes yet. So the best way to predict the impact seems to be purchase orders. As a factoring company, when one of our clients gets a purchase order from one of their customers, they request a credit approval for that customer. While our clients sell to both large and small businesses, there are two numbers that we could look at to determine who is placing the orders. In general, larger companies place larger orders, so high dollar amounts requested would imply orders from larger companies. However, the number of large companies is relatively small in comparison to the number of small companies, so by counting the number of credit approval requests we receive can help determine how many small businesses are placing the orders.
Under normal market conditions, both of these numbers can fluctuate a bit, but typically by no more than 10% in any given week. The exception to this rule is when there are holidays. Both the week of Memorial Day and Labor Day will see about 20% less business than normal. Business is typically down about 25% during the week of the 4th of July. The weeks around Thanksgiving and New Year’s typically see 40-50% less business than normal, while the week of Christmas can see 50-60% less business. The other big holiday is Chinese New Year, mainly because Chinese factories shut down so importers aren’t able to bring in new inventory for about a month. As a result, business tends to be consistently down about 10% each week during the period around Chinese New Year.
However, there is one more interesting trend that we have found in our data, in general, March is usually our busiest month. Over the last 10 years, March has been our busiest month on 4 occasions. For whatever reason, in the month of March we usually see between 20-25% more business than we do throughout the rest of the year.
While the coronavirus was first discovered in Wuhan, China at the end of December, and first reported in the US on January 20th, our data for January and February seems to be pretty consistent with what we’ve seen in past years. While the stock market started crashing on February 20th, the first week of March, the 1st-7th, appeared to be business as usual according to our data, the number of credit approval requests was average, while the dollar amounts were about 12% above average. Given that March is typically a stronger month, it would suggest that small businesses were starting to struggle a little bit, while larger businesses were doing fine.
The second week of March, the 8th – 14th, was significantly worse. Both the number of credit approval requests and the dollar amounts were down 13%. This is a pretty significant decline given that business is usually up by 20-25% during this time. With both numbers being down, it would imply that both small and large businesses were suffering significantly.
The third week of March, the 15th – 21st, saw even stranger numbers. The number of credit approval requests was down 20%, while the dollar amount was actually up 30%. This would imply that most of these credit approval requests would have been from larger businesses, and that small businesses may have experienced a 50% decline in business.
That brings us to the current week, March 22nd – 28th. The week may not be over yet, but already the numbers look grim. The number of approval requests have dropped a staggering 65%, while the dollar amounts have dropped 35% below normal. This would imply that what little business has been taking place, has mostly been with larger businesses. For small businesses that should normally being having some of their best performances of the year, we estimate their business has dropped by about 88% of what would be considered normal during this time of year. That 88% drop in business mostly pertains to small wholesalers and retailers as that is where the majority of our data comes from.
Sadly, these numbers are probably going to continue to get worse. At the time of writing, according to the New York Times, 21 states, 47 counties, and 14 cities have issued stay-at-home orders which affect roughly 200 million Americans. That puts 61% of Americans under stay-at-home orders, and that number is only going to increase. CNN reported today that a record 3.3 million Americans have filed initial claims for unemployment last week. At the height of the 2008-09 collapse, the most initial unemployment claims in a one week period was only 665,000, while the record for highest number of initial claims occurred in 1982 and was 695,000.
If there is ever a time to support local businesses, now is that time. DSA Factors will continue to report on any trends we see in the small business community throughout this pandemic, please check back regularly for future updates.
- America
- Small Business

March 24, 2020
Categories:
A Small Business Survival Guide to the Coronavirus Pandemic
It’s scary enough these days worrying about your own health as well as the health of your family and friends as COVID-19 infections seem to be growing exponentially all around the country. For small business owners, another problem is you also need to worry about the health and well being of your business. While the government may be ordering all non-essential businesses to remain closed, employees to work remotely, and most importantly anyone who isn’t feeling well, or lives with a family member who isn’t feeling well, to stay at home, they aren’t actually giving advice on how to keep your business running with reduced or no sales. Here we will discuss how to reduce your expenses during the COVID-19 pandemic, how to make responsible business decisions during a time when your customers are experiencing similar problems, and how to set your company up for a successful future once the coronavirus pandemic is over.
Reducing Expenses During the COVID-19 Pandemic
Every small business owner knows that expenses will never stop, even if the economy has stopped. You still need to pay your employees’ salaries, you have to pay rent, and even if you are closed, you will still have utility bills. Of course, you also may have financed the purchase of equipment and have other operational expenses that need to get paid. Obviously the first thing you need to do is figure out how to reduce these expenses.
Your biggest expense is most likely payroll, and this of course is your most important expense. It is your employees who make your business successful in the first place. Your employees have been loyal to you, and it is very important that you are loyal to them in a time of crisis. The last thing you ever want to do is reduce hours, or even worse, layoff your employees. Not only will do you risk losing them forever, but you are putting them under personal financial hardship. Reducing pay for your employees should be the absolute last resort you should be taking in a time like this. If your business continues to struggle and payroll is the last place that you can cut costs, make decisions with your employees. There is no doubt they will understand that the business is struggling. If you are taking a temporary pay cut, they may be willing to do the same as well in exchange for job security and continued health coverage during this pandemic.
Rent on the other hand should be something that you work hard to reduce. Assuming that your landlord doesn’t want to have vacancies that could be very difficult to fill for many years to come, they should be willing to work with you during this very difficult time. Of course, you will need to use all of your negotiating power, but it doesn’t seem unreasonable that a landlord would allow you to pay reduced rent, or even no rent, while your business is closed, in exchange for you renewing your lease for a few more years.
Utilities is another place where you can save money. Yes, you need to keep the computers running if your employees are working remotely. However, if there is no one working at the office, there is no need to keep the office at a comfortable temperature, just keep it warm enough that the pipes don’t freeze. If you have multiple offices or have multiple floors, you could potentially save some money by moving all the employees who aren’t working remotely to a single location and temporarily closing the other locations. Even just closing vents in empty offices could save you some money. However, if you decide to consolidate your business locations, please make sure that you have enough space in the office where you are consolidating to, you want to make sure employees have enough space around them in case someone comes down with COVID-19. Social distancing considerations still need to be adhered to.
If you have equipment that is financed or that you rent, perhaps this could be another place to cut costs. Just like a landlord, the financers or rental companies probably don’t want to repossess this equipment, so they should be open to allowing you to stop making payments for a while, especially if you are willing to renew your leases. On the other hand, if you have old equipment that you no longer use or could do without, now might be the time to consider getting rid of it.
Making Responsible Business Decisions During the COVID-19 Pandemic
It is important to keep in mind that you aren’t the only one struggling, all of your customers are struggling as well. As a result, it is important that you remain vigilant that every sale you make is a legitimate sale. Sadly, in times of desperation, even honest people might take desperate measures. The last thing you want is to not get paid for a sale.
It is quite likely that you have purchase orders that were placed prior to state-wide lockdowns, or even before schools started closing. If you are ready to fulfill those orders now, you should first make sure that your customers still want those orders. If your customer no longer wants the order, you should be willing to cancel it for them. Not only does this prevent you from potentially not getting paid for the order, but it also keeps your customer happy so that when all of this is over they will still want to be your customer.
It is also imperative that before shipping an order you make sure that your customer’s business is still open. The last thing you want is for a truck to arrive at their location and for the doors to be locked. You also probably don’t want to be relying on cheap but slow delivery methods. If a product takes a week to reach your customer, a lot can change during that week and a store that was opened at the start of the week may no longer be open at the end of the week. Paying for faster delivery methods is probably well worth it, even if you have to absorb the cost.
It is also important to remember that even though you already spent the money to produce the order, it is much better to have inventory than it is to not get paid for your merchandise. It may be tough to walk away from an order, but the alternatives are much worse. So while businesses are still suffering from the coronavirus, it is imperative that you consider every business decision with a magnifying glass, and don’t be afraid of losing a sale.
Setting Up Your Business for Success After the COVID-19 Pandemic
You may be struggling now, but that doesn’t mean that you also need to be struggling once the coronavirus pandemic is over. You and your employees may find yourself with a lot of time on your hands, so take advantage of that. That doesn’t mean that you should turn on the TV or play games. Instead use this time wisely. When was the last time that you had an entire week to dedicate to marketing? What about research and development? And it’s not just you, it’s all of your employees. This could be a wonderful opportunity for you and your employees to discover skills you never knew you had and put them to excellent use. If someone is artistic, perhaps they could come up with some new marketing material. If someone plays guitar, maybe they could write a catchy jingle for the business. Someone who spends a lot of time on Facebook could maybe come up with a new Facebook campaign. If you’ve never made a YouTube video before, maybe now is the time to experiment and make one. Who knows, when this is all over, maybe some of your employees will have some new responsibilities.
Another key is constant communication. It’s easy to forget about someone if you don’t hear from them for a while. So even if you aren’t trying to make a sale, just sending out an update to your customers is a good way to remind them that you still exist. The update doesn’t even need to be about coronavirus, in fact, given that we are getting bombarded with information about the disease perhaps it’s even better you don’t. If you need some ideas about what to send out, April Fools Day is coming up and everyone could use a good joke right about now. So are the holidays of Easter and Passover, a simple holiday wish could go a long way at a time like this. Want to send out a message that doesn’t pertain to any particular day, not a problem. Now that your kids don’t have school, perhaps you could share some of their artwork they made at home with your customers. It doesn’t really matter what you send, the key is that you are still here and will continue to be here once all of this is over. Once we are back to business as usual, it will be the businesses that remained active throughout the pandemic that will ultimately be in the best position to thrive.
There is a lot we still don’t know about the COVID-19 pandemic, including when it will be over. Unfortunately, many small businesses have already closed their doors and some may never reopen. However, by being smart, not only can you avoid getting sick, but you can ensure that your small business will get through these difficult times and may even become stronger because of them.
- America
- PO Financing
- Small Business

September 13, 2019
Categories:
How To Survive The Tariffs
The trade war has been all over the news for months now, and the uncertainty these tariffs are creating a wreaking havoc on small businesses all around the country. Trying to keep up with the constantly changing tariff rates is nearly impossible, but even more impossible is creating a business plan around the tariffs because all it takes is a single tweet and the tariffs change once again. Sometimes tariffs change so fast that you might have an order in production or already on a boat that you are going to now have to pay more for when it arrives at the port. But of course, there is one thing that is perfectly clear about who is going to pay for the tariffs. It won't be China paying for the tariffs but the entire levy is falling directly on American small businesses.
There is no doubt that times are tough for American small business owners. When that ship arrives at the port, you are the one who has to pay the tariffs, and you are the one who has to decide if they come out of your margins or if they need to be passed along to your customers and ultimately American consumers. Your options to choose from are bad and worse, and most likely there is no one clear cut choice but rather you will need to make compromises everywhere. In the end you will have smaller margins, a higher priced product, and will be doing less volume. To make matters worse, if the tariffs get lowered or removed on product you already have in inventory, all of a sudden you have to discount all of your merchandise and that may completely wipe out your margins.
Perhaps you can find a new factory in Vietnam to avoid the tariffs, and maybe you will even save some money by moving in the long run. It's a great idea, but don't think that you are the only one who has it, everyone else is also looking at Vietnam, as well as Indonesia, Thailand, Malaysia, and India. What does this mean for you? Well if you are used to getting 30 day lead times from your factory in China, your in for a big shock when you learn that Vietnam's lead times were 60 days at the start of the year, and have now increased to over 120 days. Combine that with the fact that you need to find a new factory that is able to produce product to your quality standards and, even more difficult, is willing to take on new business. Those of course are just the initial hurdles you need to overcome in finding a new factory, nevermind that many of your raw materials may still be coming from China and subject to tariffs. Of course the worst part is that you have probably spent years developing a good working relationship with your factory, and if you leave now, you will be back to square one.
There is no doubt that these are tough times for small businesses, and you are probably being faced with difficult decisions everyday. Regardless of which route you decide to take, there is no debate that you will be the one paying for these tariffs, and you will have to do so with lower volumes and thinner margins. So the question is how will you be able to pay for them. At DSA Factors we are proud to offer our clients purchase order financing, so that you have the funds necesary to pay both your suppliers and the tariffs.
With purchase order financing we will provide you with the funds you need when you need them. That means you choose how much money you need and when you need it. You can borrow some money for the deposit to start production, more money to pay for the completed product before it ships, and even more when it arrives at the port and you need to pay the tariffs. Or maybe you have the funds necesary to pay the factory for the product, you just need a little cash for the tariffs. Whatever your situation, our goal is to make sure that you have all the necessary funds you need to keep your business running, but charge you the lowest fees possible so that you can maintain healthy margins.
Want to learn more about how purchase order financing can help get your business through tough times, give us a call today at 773-248-9000.
- America
- Furniture
- Trade Shows

March 18, 2019
Categories:
DSA to Attend Home Furnishings Manufacturing Solutions Expo
DSA Factors has always been committed to serving the furniture industry, so this year we will be traveling to Hickory, NC to attend the Home Furnishings Manufacturing Solutions Expo. The show will be taking place July 17-18 at the Hickory Metro Convention Center.
This is the third year of the show with previous shows having taken place in Atlanta, GA and Greenville, SC. There will be a wide range of exhibitors at the expo including machinery, software, logistics, and of course factoring. DSA Factors is excited about being a part of this year's expo.
Whether you are one of our clients, a prospective client, or simply want to learn more about accounts receivable factoring and purchase order financing, please stop by booth 1322 and Ben and Max will be happy to speak with you. As a courtesy to all of our guests, you may register for the show using promo code DSA19 to receive a free badge.
We look forward to seeing you this July in Hickory!
- America
- Factoring
- Fintech
- Financing
- Insurance
- Retail
- Technology
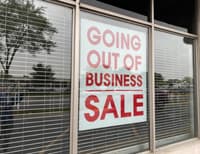
April 20, 2018
Categories:
Surviving the Brick and Mortar Meltdown
Today Bonton began its liquidation sales, by the end of August there will be no more Bergner's, Boston Store, Carson's, Elder-Beerman, Herberger's, or Younkers. It was only last month that Toys'R'Us made the same exact announcement. On top of that, Sears, J.C. Penny, Neiman Marcus, Lord and Taylor, and Macy's have all been closing many locations, and now things are looking very bad for Bed Bath and Beyond. Even Walmart closed 63 Sam's Club locations at the start of the year. Things have gotten so bad that it was barely even news when Nine West filed for bankruptcy last week. So what does this mean for the retail environment?
Certainly things aren't looking too good. Bonton is a major department store that anchors many malls. For smaller retailers in the mall, losing Bonton could mean loosing foot traffic and maybe even permanently closing their stores as well. For other struggling anchors in the mall, it might give them reason to close their store in the struggling mall. In malls that have already lost an anchor, losing a second anchor could be the end for the mall. While we have seen many big box stores in strip malls close, this is the first time that we are seeing a major department store and mall anchor close all its locations. There is a very real possibility of it having a snowball effect with the other struggling department stores.
Of course, as a manufacturer or importer, you not only have to worry about the next bankruptcy filing, but also losing a major customer. In many ways, the latter can be much worse. The proof of this is Mattel and Hasbro. Both their stocks took a major hit when Toys'R'Us filed for bankruptcy, and then another when they announced they would be closing all their stores. In fact, billionaire Isaac Larian, owner of Little Tikes and many other toy companies, tried to purchase Toys'R'Us out of fear of what its closure could do to the toy industry.
Certainly you need to be selling to online retailers like Amazon, however, you can't only focus on online. Amazon might be one of the major reasons why all these stores are closing, in fact they announced on Wednesday that they now have 100 million Prime subscribers. But to focus only on Amazon is also problematic, after all, you don't want to have all of your eggs in one basket or limit where your customers can purchase your product. Plus, many of your customers may want to touch and feel the product before they purchase it, something that isn't (yet) possible with Amazon.
Of course, selling to brick and mortar can be very scary right now. While one option might be the increasingly popular taking a discount to get paid early, doing so won't actually protect you. The bankruptcy laws require you to pay back any money you received within 90 days of a company filing for bankruptcy if it is believed you received preferential treatment. Toys'R'Us was working with C2FO to offer its vendors early payment in exchange for a discount prior to filing for bankruptcy, and you can be sure that anyone who received early payment at a discount, is now returning that payment back to the bankruptcy court. What might have seemed like a smart option at the time, in the end did not offer vendors any protection.
Really the only thing that can protect you is by partnering with someone who is doing the credit checking for you, staying on top of breaking news, and offering you insurance. While credit insurance is available for extremely large, credit-worthy accounts, it typically isn't available for smaller companies or companies that show even the slightest inkling of financial distress. Non-recourse factoring on the other hand provides you with the protection you need on the widest range of customers available.
DSA Factors has been offering non-recourse factoring for over 30 years now. When you partner with DSA Factors, we handle all of the credit checking for you as well as provide you with insurance on the receivables which we approve. As an added benefit, we help improve your cash flow by funding you the same day you ship and invoice your customers. For more information about how factoring can help your business, give us a call at 773-248-9000.
- America
- Financing
- Fintech
- Technology

September 29, 2017
Categories:
Bloomberg Warns that Fintech May Lead to Our Next Financial Crisis
It's been almost ten years since our last financial crisis was caused by banks that were too big to fail. However, Bloomberg is warning that the next collapse will be tied to Silicon Valley rather than Wall Street. Over the last ten years the government has tightened regulations on Wall Street to ensure that we won't find ourselves in the same situation that occurred in 2008. However, there has also been a revolution in the world finance by startup companies incorporating new technologies.
While most people are aware of the new regulations that have been placed on the too-big-to-fail banks. It is now nearly impossible to get a small business loan, and even refinancing a mortgage on your home requires massive amounts of documentation that can take you weeks or months to put together. However, not many people are aware of just how large and diverse Fintech companies have become.
While Fintech has entered the world of factoring, its reach extends well beyond factoring into all other arenas of finance. There are Fintech companies that give out business loans, do crowd funding, give computer generated advice, and there are even virtual currencies such as Bitcoin.
The main issue with these new Fintech companies is that unlike the institutions that existed prior to the crash, these new businesses have no oversight. Not only has the government avoided regulating the industry, but the very idea of Fintech implies that there aren't humans making the credit decisions, instead decisions are made based on complex algorithms that are hosted on internet servers. Without any human input going into financial decisions, it is quite possible that businesses may learn how to manipulate the systems and receive funding that they shouldn't qualify for.
Of course the biggest threat to the industry is hackers, who have been breaking into systems and stealing sensitive information at an incredible rate recently. In fact, it was just announced today that Whole Foods' restaurants had been hacked and credit card information had been stolen. The world of Fintech has already been attacked. In 2014 a security breach put Mt. Gox, the world's largest Bitcoin exchange at the time, out of business and cost Bitcoin owners $3.5 billion in today's dollars. To make matters worse, the security breach apparently happened in 2011 and went unnoticed for three years.
While there is no clear cut solution to the problems presented by Fintech, the fact is, Fintech has had an incredible impact on the world of finance over the last ten years. Furthermore, while many Fintech companies have come and gone, overall as an industry, it doesn't look like Fintech is going to slow down any time soon.
UPDATE: Breaking News
Former Securities Exchange Commission Chairman Arthur Levitt spoke out yesterday at the Economist's Finance Disrupted conference in New York. At the conference he stated, "Fintechs tend to march to their own rules. It's a new industry with lots of failures and lots of spectacular successes. But regulation is often kind of background music, and the prevalence of scandal and mismanagement and aggressiveness is part of the backwash of innovation. Hardly a day goes by where there isn't a recording of some scandal or another"
At the same conference, Scott Sanborn, CEO of Lending Club said "We do need to take responsibility in [Silicon Valley] where there is a mentality of growth at all costs, and if you don't have the right checks in place, the right kind of board in place, and plenty of people with audit and risk experience that are providing the right kind of governance, you can have problems."
- Amazon
- America
- Furniture
- Retail
- Technology

June 30, 2017
Categories:
How Would an Amazon Furniture Store Impact the Furniture Industry
Amazon is already a retail giant, but up until recently all of their sales have existed only online. However, that is slowly changing. In November 2015 Amazon opened its first brick and mortar bookstore in Seattle, and has opened a handful more across the country in the last year. They also started experimenting with cashier-less grocery stores at the end of last year. Of course the big news came a couple of weeks ago when Amazon announced they would be purchasing Whole Foods for $13.7 billion. While Amazon is yet to open a brick and mortar furniture store, there have been reports that they are looking into doing so. If, or when, they do open a furniture store, you can bet that it will have some pretty dramatic effects on the furniture industry.
Amazon and the Book Industry
Amazon of course started off as an online book store back in 1995 and didn't turn a profit until 2001. The impact that Amazon has had on the book industry has been dramatic. They drove Borders, a 500+ store chain and former Amazon partner, out of business in 2010. Barnes and Noble has survived but is struggling. So it is interesting that the company that has been responsible for closing hundreds of bookstores around the country, and has no problem selling books online, would want to open up their own bookstores. Of course, for a company like Amazon, the cost of opening up a bookstore is insignificant, and it could be worth it to Amazon to open these stores even if the stores themselves are not profitable since they can be used as market research and for marketing Amazon's other services such as Prime. The fact that these bookstores are popping up slowly and only in several cities may indicate that indeed the stores are not profitable on their own.
Amazon and the Grocery Industry
Groceries, however, unlike books, have been a much bigger problem for Amazon. While non-perishable foods can be shipped, they are also heavy and shipping them can be expensive. Of course fresh produce is much more problematic, not only does it have a short shelf life, but most consumers wouldn't want someone else picking out which bananas or cut of meat they are purchasing. Then you have refrigerated or frozen foods, if it took Amazon two days to deliver your milk, it would go bad long before it arrives at your doorstep. At the end of last year Amazon started experimenting with several grocery store concepts in Seattle. Amazon Go offered cashier-less convenience stores. You simply walk in, take the food you want, and walk out, with your credit card automatically getting billed. Amazon Fresh Pickup allows customers to order food online and then pick it up at a nearby drive-thru. While Amazon Fresh Pickup still doesn't address the issue of allowing consumers to pick their own produce, it at least addresses the issue of short shelf life and refrigeration. But just like with bookstores, which also started out in Seattle, these stores are being rolled out slowly and Amazon still has an insignificant market share of the grocery industry.
That of course has all changed with Amazon's buyout of Whole Foods and its 460+ stores across the nation. In a matter of seconds Amazon made a major move not just into the grocery industry but into brick and mortar retail. They instantly gained hundreds of locations around the country where customers can pick up orders, drop off returns, and do their shopping all at the same time. They also can roll out some of their new technologies on a much larger scale than they have done so far.
Amazon and the Furniture Industry
The Challenges of the Furniture Industry
With Amazon apparently solving their grocery problems, that leaves only one other industry where Amazon is struggling to get their foot in the door, the furniture industry. While furniture may not go bad like fresh fruit and vegetables, it has its own challenges. First of all, it is a major purchase, even the cheapest pieces will cost you at least a hundred dollars, and if you are updating a room you can expect your bill to be in the thousands. When making such a large purchase consumers are going to take their time to shop around to make sure that they are getting exactly what they want. In the case of upholstery and bedding, consumers need to touch and feel the product to make sure that it is comfortable. Furthermore, many furniture purchases are custom orders where the consumer picks the colors and finishes they want. As a result retailers are not able to stock the merchandise but instead need to order it, meaning it could take anywhere from 4-12 weeks for the consumer to receive the merchandise. This doesn't work well with Amazon's goals of reducing delivery time from two days to two hours. But of course the largest problem with furniture is delivery. Furniture is bulky, heavy, and easily damaged. While it can easily be transported to distribution centers and stores, it is delivering it the final mile into the consumer's home that presents the greatest challenge, along with assembly for items such as beds that would not be able to fit through doorways if they were delivered fully assembled.
How does Amazon Enter the Furniture Industry?
So of course the next question is what will Amazon do? Amazon has committed to selling furniture; they have opened up showrooms in both Las Vegas and High Point. While it is possible that Amazon may experiment with opening its own stores, it is likely that when they are ready to make the jump into brick and mortar furniture, they will buyout a furniture retailer. Of course, there are very few furniture retailers that have locations nationwide like Whole Foods, but Amazon doesn't necessarily need to purchase a furniture retailer. Purchasing a department store might make greater sense as they are larger, have more locations, and would allow Amazon to sell other merchandise that is difficult to sell online, such as appliances and clothing.
If you start looking at department stores, Amazon has a lot more opportunities as many of the department stores are struggling, mainly due to having to compete with Amazon and other online retailers. Purchasing Macy's would give them access to 800+ locations around the country. JC Penny would give them over 1000 locations. But most interesting is perhaps the department store that has told its investors that it may not be able to keep its doors open. If Amazon were to buyout Sears, not only would they be able to purchase it at a bargain price, but they would immediately have access to over 1500 retail locations and a wealth of real estate all around the country.
Of course all of this is just speculation, what isn't speculation is that Amazon is going to do something in the furniture industry. There is talk of them using technologies such as virtual reality or augmented reality so that you can picture what a particular piece of furniture would look like in your home. Another possibility is offering delivery windows within hours of when you make a purchase in their store. But whatever they do, it is going to be big and everyone is going to have to keep up with Amazon if they don't want to lose out.
What will be Amazon's Impact on the Furniture Industry?
FURNITURE RETAILERS
While retailers will face stiffer competition, they may also benefit from the new technologies that Amazon brings to the industry. If existing furniture stores are able to adopt Amazon's technologies, they too could use those technologies to increase sales. Of course, the real advantage to traditional retailers comes in the area of customer service. A company like Amazon will never be able to provide personalized service and most likely wouldn't have trained salesmen who know about all the products in their store, instead they will probably rely on Amazon reviews like they do in their bookstores, and perhaps a specific customer's buying trends. While Amazon may already know if a customer is looking for a more traditional or contemporary look based upon their online purchasing patterns, a traditional salesman can simply ask the customer what they are looking for and forget about all the algorithms. By offering exceptional customer service and a knowledgeable staff, current furniture retailers should be able to compete with Amazon and would definitely do better in customer retention.
FURNITURE VENDORS
From a vendor's point of view, Amazon stores can potentially open up more possibilities. Smaller vendors, who have trouble getting floor space in the showrooms of larger furniture retailers, may have an easier time getting floor space in an Amazon showroom. While certainly Amazon could offer everything online, it will be limited in what they can display in their showroom by the amount of real estate they have. Unlike traditional furniture retailers who buy from a handful of vendors, Amazon purchases from everyone and that of course is what sets them apart.
If Amazon's bookstores are any indication of how they do business, products that perform better online will have the upper hand. At Amazon bookstores there is a very limited selection of books, and the selection is not based on which books Amazon's buyers feel should be on the shelves. Instead the book selection is all determined by algorithms which look at sales volume and customer reviews of each book. As a result, a category that has a more limited selection but sells modestly well may get more shelf space than a hugely popular category that offers a much wider variety of books to choose from. For example, Amazon bookstores have an excellent selection of recipe books which individually sell well online, but a very limited selection of fiction, a category that performs incredibly well as a collective group, but not as individual titles. Furthermore, where a traditional bookstore will feature every book that Dr. Seuss ever published in their children's department, Amazon bookstores would probably only have one or two of his books that sell extremely well online, if any. There is no reason to believe that Amazon wouldn't take the same approach in a furniture showroom.
This could be huge for niche manufacturers. While overall your sales volume may look insignificant when compared to someone like Ashley, if you have a single unique product on the market that sells very well, it is quite possible that it would get floor space in an Amazon showroom. While Ashley may offer 1000 different products, it means that each product only gets a thousandth of Ashley's overall sales volume, and your single product receives 100% of your sales volume. As a result, your single product would have better sales numbers than any individual Ashley product, and if it receives positive customer reviews, it would perform better in Amazon's algorithms.
If there is any lesson to be learned from this, it is quite simple, online matters. If you don't want to get left behind, you need to bring your business online, and the more you offer the more you have to gain. Getting sales and positive reviews right now on Amazon could result in even greater sales volumes in the future when Amazon starts opening brick and mortar stores. If you are looking to get your product for sale online, DSA Factors is here to help. We provide factoring for Amazon receivables, as well as Wayfair, Hayneedle, One Kings Lane, Zulily, and many other online stores. Give us a call today at 773-248-9000 to learn more about how DSA Factors can help you grow your online business.
- America
- Consumers
- Retail
- Small Business

July 15, 2016
Categories:
Made in USA - Supporting American Manufacturing
It used to be that you would purchase a product and on it would be a tag featuring the stars and stripes and would say "Made in USA". However, as our shopping habits have evolved, with more and more people doing their shopping online, and big box stores becoming pretty much the only option for traditional brick and mortar shopping, that "Made in USA" label is becoming harder and harder to find. Despite these changes and a rapidly developing global market, it should come as no surprise that the old "Made in USA" tag is becoming more and more sought after. Many Americans have even joined the "Shop Local" movement and make an effort to do as much shopping as they can at mom and pop stores in their community.
While you probably have seen "Shop Local" stickers in suburban downtowns and throughout the neighborhoods of big cities, there is a lot more to the movement than just shopping at a store whose owner happens to be your neighbor. Many of these stores will strictly source merchandise that is manufactured here in America. So by shopping locally you aren't just helping out your neighbor, but you are also helping out your fellow Americans by creating manufacturing jobs right here in the states, rather than outsourcing those jobs overseas.
How Important are American Made Products to Consumers?
Just how important is it to consumers to purchase an American made product? According to research done by Consumer Reports, eight in ten Americans would prefer to purchase an American made product over an import, and six in ten would even be willing to be 10% more for a product that was made here at home. Furthermore, two in three consumers prefer to shop in stores that advertise American made products. However, more than half of consumers still believe that American made products are too costly.
There are many reasons why consumers prefer to buy products made in America. One reason is patriotism, a lot of consumers take pride in the fact that the products in their home were made in America. Consumers also like that they are creating jobs and supporting the American economy when they buy an American made product. However, the most important factor may simply be the quality of the product, most consumers believe that when they buy a product that is made in America that it is something that will last for a long time.
The Cost of Manufacturing in America
Despite the fact that consumers prefer American made products, the cost of labor in America is the reason why most manufacturers still prefer to produce their products overseas. It has nothing to do with America having a high minimum wage, in general most factory workers in America are skilled professionals who get paid at a much higher rate than minimum wage. In addition to this they also receive benefits such as health insurance and 401Ks, along with paid vacations and sick leave.
Then there is the question of materials, its one thing for a product to be assembled in America, but it's another thing for it to be assembled in America from parts or materials that are also American made. If a factory is purchasing metals, plastics, or fabrics that are made in America, their suppliers also have to deal with higher expenses which of course impact the price of the raw materials that manufacturers purchase.
Advantages to Manufacturing in America
Despite these higher costs, there are still many advantages to producing merchandise here in the USA. It isn't just the quality of the product, but also the quality control. If a product is being made overseas, the importer may have little control over how it is being made, and may not even be aware of any issues until it arrives at an American port a month after it has already been paid for. Of course the most obvious benefit is that the product does not have to be transported from overseas. This not only saves money, but it also saves time. It doesn't need to spend a month on a ship and then go through customs before you have access to it, and that's assuming that there aren't any port slow downs. You also don't need to fill an entire container in order to receive your product.
Of course the most important benefit to American manufacturing is consistency. American factories can produce goods 365 days a year. Yes, employees request time off for vacation, but those vacations are staggered so that a factory is never short-handed. In China, and other parts of Asia, factories have to shut down for an entire month as employees return to their homes to celebrate Chinese New Year. Even worse, when Chinese employees return from New Year celebrations, they tend to find a new job at a different factory. As a result you not only need to train an entire team of new employees every year, you never have any employees with the experience required to make high quality products.
Furniture Manufacturing in America
When you consider all of these factors, you actually can put together a pretty good argument for American manufacturing. However, in the furniture industry, manufacturing in America becomes even more important. By offering American made products you can also offer custom made furniture, allowing consumers to choose the configuration and sizes they want along with the finishes or fabrics they want. With overseas manufacturing you would be left with lead times of art least 10-12 weeks, but with domestic manufacturing lead times may be cut down to 4-6 weeks, which coincides very nicely with how long it usually takes a home buyer to close on their new home. These reduced lead times are also very important if a replacement part needs to be ordered and your local store doesn't have any in stock.
As a result of these benefits, American manufacturing definitely plays a very important role in the casual furniture industry. According to Casual Living, three quarters of outdoor specialty shops carry American made lines, and four in ten consumers prefer to purchase American made products. The only features that are more important than where the furniture is made are price, comfort, and style. Again the main reason why consumers prefer to buy American is because they believe it is higher quality, and as a result, most high end merchandise is manufactured in the USA.
The only thing that may surprise you, despite the Shop Local movements strong grass roots efforts and social media presence, only 10% of Millennials believe that it is important to buy American made products. This number is slightly higher among Millennials that are married and have families, as well for those who live in the North and the West. However, there is another figure that does bode well for American manufacturing. 93% of all Millennials are willing to pay more for an American made product, with the vast majority willing to pay 20% more for a product with a "Made in USA" tag on it.
Financing American Manufacturing
If you are an American manufacturer and need help making payroll or paying your suppliers, look no further than DSA Factors. Our accounts receivable factoring program can provide you with the cash flow you need to grow your business. We are family owned and operated business based out of Chicago, Illinois who provides nationwide factoring services. Your customers prefer to Shop Local, so you should to. Partner with DSA Factors and you can outsource your accounts receivable to a family owned business right here in the USA!
- America
- Furniture

November 23, 2015
Categories:
Home Sizes on the Rise
With so much interest in tiny homes and urban living, it may come as a bit of a surprise that new homes are actually increasing in size. According to a study by Furniture Today and the US Census Bureau, the average home built in 2014 was 2,657 square feet, a 2.3% increase over 2013's 2,598 square feet. Of the 620,000 new homes built in 2014, 45% of them had 4 or more bedrooms, 36% had 3 or more bathrooms, and 31% were over 3,000 square feet.
While the average home size for the entire country is increasing, it is interesting to note that different regions are growing at different rates. Leading the pack is the Midwest which experienced 7.3% increase in size last year and a 13.6% increase since 2010. However, despite such large growth, especially in the last year, the Midwest still has the smallest homes in the country. The average new home in the Midwest last year was 2,574 square feet, up from 2,398 square feet in 2013 and 2,265 square feet in 2010.
Following the Midwest comes the South, which now has the largest homes in the country at 2,711 square feet for homes built in 2014. While this is only a 0.8% increase over 2013's 2,689 square feet, it is a 13.2% increase over 2010's 2,393 square feet.
Out West houses have been growing at a much more stable rate with the average new home in 2014 at 2,603 square feet. This was a 3.2% increase over 2013's 2,523 square feet, and a 9.1% increase over 2010's 2,386.
While the Midwest, South, and West are seeing much larger houses getting built each year, it may come as a surprise that the Northeast, which had the largest homes being built in 2010 at 2,613 square feet, has pretty much stayed level. In 2014 the average new home was 2,617 square feet, a 0.7% drop from 2013's 2,635 square feet.
With home sizes getting larger in 3 out of 4 regions of the US, this can translate to consumers buying more furniture while also looking for larger individual pieces of furniture. According to data collected by Furnituredealer.net in the first six months of 2015, the most popular dimensions for a sofa are 87" long, with a depth of 39.4", and a height of 37.6". When it comes to sectional sofas, consumers are looking for a footprint of 116.1" by 98.3" with a height of 37.7".
If you are a furniture manufacturer, it's important to keep up on housing trends and make sure that the furniture you are making meets the demands of today's consumers. If you are spending all of your time chasing down past due receivables, it's hard to stay on top of what really matters. Let DSA Factors factor your accounts receivable for you, not only will you save time and money, but we will also improve your cash flow.
* In this study, the Midwest includes Illinois, Indiana, Iowa, Kansas, Michigan, Minnesota, Missouri, Nebraska, North Dakota, Ohio, South Dakota, and Wisconsin. The Northeast includes Connecticut, Maine, Massachusetts, New Hampshire, New Jersey, New York, Pennsylvania, Rhode Island, and Vermont. The South includes Alabama, Arkansas, Delaware, Florida, Georgia, Kentucky, Louisiana, Maryland, Mississippi, North Carolina, Oklahoma, South Carolina, Tennessee, Texas, Virginia, Washington DC, and West Virginia. The West includes Alaska, Arizona, California, Colorado, Hawaii, Idaho, Montana, Nevada, New Mexico, Oregon, Utah, Washington, and Wyoming.
- America
- Consumers
- Furniture

July 10, 2015
Categories:
From Red to Blue - Color is Popping Up All Around
More and more people these days are looking for color in their homes, and this is affecting everything from paint to upholstery. While red has always been a very popular color in the home, blue is starting to pick up steam and quickly becoming the most popular color for upholstery, especially in the US.
It has become more and more important recently for furniture manufacturers to not just get your attention, but to get your attention in a split second. With so many choices, and better informed shoppers, consumer's attention spans are getting shorter and shorter. One of the best ways that a furniture manufacturer can grab someone's attention these days is with a strong, vibrant color. Traditionally the color of choice has always been red, and red is still a very good choice of color even today. But blue, a color that didn't use to be very popular, has been picking up a lot of steam recently and has become America's most popular color in the home. Especially blues that have bit of green in them and teals.
A recent survey in Furniture Today shows that blue has become America's favorite color for upholstery. 33% of Millennials (age 18-34) call blue their favorite color in the home, as do 26% of Generation X (age 35-50) and 28% of Baby Boomers (age 51-69). That is nearly one third of the market that prefers blue today, and many color experts believe that blues popularity is only going to continue to grow. However, it isn't all blues that are doing great, lighter blues still aren't all that popular in the home. It is the darker blues, such as navy, that are really becoming popular.
Of course blue's gains are coming at the expensive of other popular colors, particularly red, which had long been America's most popular color. While 30% of Baby Boomers prefer red, that percentage drops to only 23% of Generation X and 12% of Millennials that call red their favorite color. Despite losing some ground to blue, red is still America's second most popular color.
What is a bit more surprising than blues recent popularity, are the other colors that are starting to become more popular than red. Yellows and Greens which were never very popular with Generation X or Baby Boomers, have surpassed red when it comes to Millennials. 15% of Millennials call yellow their favorite, while 14% call green their favorite.
The other big color, orange, however is losing some steam. Orange is most popular among Generation X with 20% of them considering it their favorite color, but it drops to 13% with Baby Boomers and only 10% with Millennials.
If you are having trouble keeping up with the latest color trends, give DSA Factors a call today at 773-248-9000 and ask about our accounts receivable factoring. While we can't help you pick out colors, we can help you with credit checks and collections so that you have more time to focus on your product line, and can make sure you choose the right colors.
- America
- Factoring
- Financing

September 20, 2013
Categories:
As the economy continues to recover...
As the economy continues to recover, American businesses have a unique opportunity to grow their businesses as a way of preparing for the future. One of the simplest ways of doing that is through accounts receivable factoring.
Accounts receivable factoring services, often called "invoice factoring services" are a useful method of small business financing that enables business owners to budget and plan better by creating consistent cash flow. The small business sells its invoices to the factoring company at a small discount. The factoring company, in return, pays the small business, usually within a couple of days. This means that instead of waiting 30 to 90 days for customers' payments, the small business has its funds almost immediately.
Additionally, accounts receivable factoring enables small businesses to save money on their in-house accounts receivable work. Factoring companies provide not only funds, but also help collect on invoices and manage accounts receivable. The factoring company handles mailing out statements, which reduces printing, mailing, and personnel costs. As well, the factoring company provides access to advanced credit-screening tools to help small businesses decide how much credit to extend and to whom. This minimizes credit risk, again saving companies money.
The time and money small businesses save by using invoice factoring services are resources that can be put into growth opportunities. New equipment, staff training, marketing campaigns and other growth-oriented costs are easier to plan for and pay for when a company knows what its monthly budget will be, as it does with invoice factoring. The economy is improving. Will your small business be ready to meet the demand?
- America
- Furniture

November 29, 2011
Categories:
DSA Factors is Ready to Help a Rebounding American Furniture Industry
According to the Boston Consulting Group (BCG) recent report titled "Made in America, Again: Why Manufacturing Will Return to the U.S.", we can expect to start seeing furniture manufacturing returning to the United States. In fact BCG believes that furniture is just one of seven "tipping-point" industries that will start moving manufacturing jobs from China back to the US. The list of industries includes the automotive, electrical equipment and appliances, furniture, plastics and rubber, machinery, fabricated metal products, and the computer and electronics industries. These industries account for approximately $2 trillion in sales annually and account for 70% of all Chinese imports. Additionally this can lead to the creation of 2 to 3 million jobs in the United States.
According to BCG, Chinese wages have been rising at 15-20% per year, while the Yuan RMB has been appreciating against the US Dollar. The once enormous labor gap cost will shrink to less than 40% by 2015. As a result the industries mentioned above which have a relatively low labor cost, compared to high costs of shipping, materials, security, delivery responsiveness, and quality control, will begin to move manufacturing of products back to the US for sales throughout the Americas and Europe. The Chinese will not be closing their factories as they will still have a competitive advantage in Asian markets, but their competitive advantage will disappear in North America and most likely in Europe as well.
BCG does mention that Mexico will still have a much lower labor cost than either China or the US, and some manufacturing jobs will almost certainly go to Mexico. However the vast majority of manufacturing should be coming back to the US due to our larger skilled workforce and for logistical and security reasons in these tipping-point industries. The clothing and textile industries, however, most likely won't be returning due to their high percentage of labor costs which will allow the Chinese to keep their competitive advantage.
These changes are already becoming apparent. From 2001 to 2004 Chinese imports grew by about 20% per year. However, there have been dramatic decreases in recent years with imports flattening out and even declining in 2009, not just for Chinese imports but for imports from all low-cost nations.
At DSA Factors we are proud to support the American manufacturing industry and are ready to help out anyone, big or small, who is bringing manufacturing back to the US. We are located in Chicago and have been serving the furniture, bedding, giftware, housewares, trucking, staffing, and many other industries since 1986. We have helped many companies to grow over the years and will work with you to grow your business.